You have defined now all parameters of the response spectrum analysis load case. Click Calculate to start the spectral analysis of LC6.
You can see in the 'Calculation Progress' dialog box that LC6 is calculated several times: Sub-results are determined for every Direction and every Mode shape that are then superimposed giving the "envelope" of all extremes. As the 'Save results of all selected modes' option has been activated in the Spectral Analysis Settings , it is possible to evaluate any of those sub-results.
As soon as the calculation is done, the above-mentioned envelope of the deformations |u| is displayed in the work window. They represent the real deformations, not any scaled results as with a modal analysis.
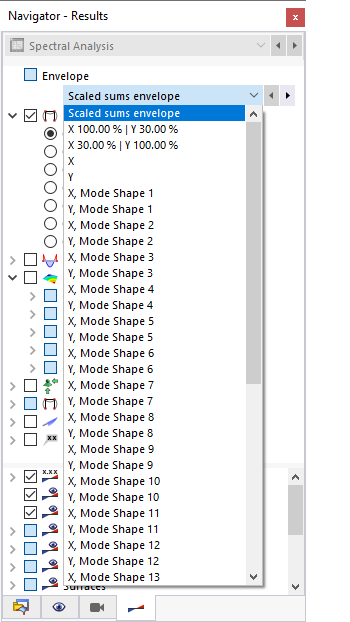
You can control in the Navigator - Results which sub-results are displayed. Open the list to check the deformations specific to every direction of the response spectrum and to every relevant mode shape.
The list also enables you to access the deformations of the scaled sums as well of the directions X and Y.
The 'Envelope Values' category provides specific options for you to display the maximum or minimum results instead of both ones simultaneously.
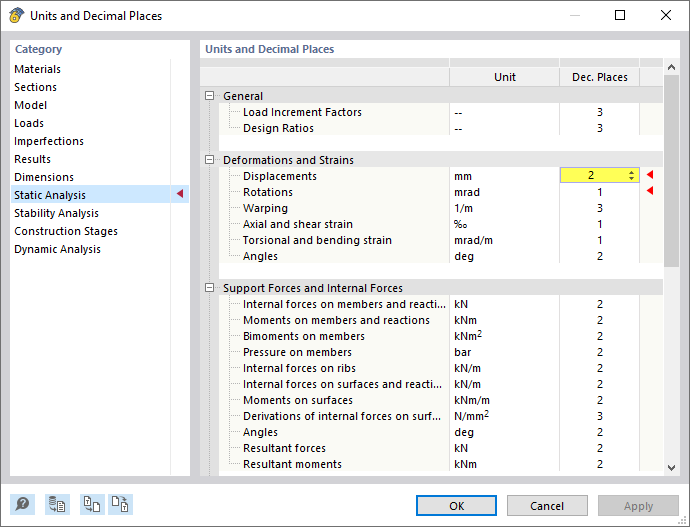
As you will have noticed, the deformations resulting from the spectral analysis are very small. This is due to the fact that the model is rather rigid. If you want to increase the decimal places of the deformations, you can use the
![]() button on the table toolbar, or click Edit on the toolbar and then select the Units and Decimal Places option.
button on the table toolbar, or click Edit on the toolbar and then select the Units and Decimal Places option.
In the 'Units and Decimal Places' dialog box, select the Static Analysis category. Enter 2 decimals for the 'Displacements'. Then click OK to apply the modification.
The results are also listed in the tables. The data mostly corresponds to the results available for static analyses. In the Pseudo Accelerations table, however, you can additionally read the accelerations that are applied to the nodes of the fictitious single degree-of-freedom oscillators model.
There are two values for every node, each representing the maximum and minimum value.





.png?mw=350&hash=02b4523ff83989aba398f1146fe13dbc060c5f29)






-querkraft-hertha-hurnaus.jpg?mw=350&hash=3306957537863c7a7dc17160e2ced5806b35a7fb)


