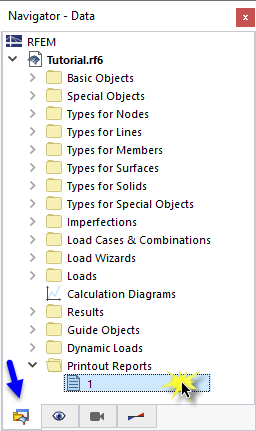
The dynamic analysis data can be added to the printout report that was created in Part 1. To open this document, double-click the 1 item in the Printout Reports category of the 'Navigator - Data'.
Chapters 9 and 10 of the printout report contain the default data of the dynamic analysis.

Adjusting the Contents
To add or remove a chapter, you can use the 'Printout Report Manager' as described in Part 1. Open that dialog box by clicking the
![]() button on the printout report toolbar (second from the right). Alternatively, select Edit Printout Report on the Edit menu.
button on the printout report toolbar (second from the right). Alternatively, select Edit Printout Report on the Edit menu.

In the 'Report Items' area, select these checkboxes to add the corresponding chapters:
- Category 'Load Cases & Combinations': Design Situations, Load Combinations, Result Combinations, Modal Analysis Settings, and Spectral Analysis Settings
- Category Dynamic Loads
- Category 'Modal Analysis Results': Effective Modal Masses
- Category 'Spectral Analysis Results': Nodes - Pseudo-Accelerations
Click Save and Show to close the 'Printout Report Manager' and update the printout report.

You will notice that the printout report has become rather comprehensive. This is mainly due to the detailed subresults of the spectral analysis. It is advisable to reduce the documentation by including only the scaled sums envelope results.

Right-click the 11.4 Lines - Support Forces item in the navigator, for example. Select Edit in the shortcut menu to open the 'Printout Report Manager' again.

Activate the 'Subresults filter' in the 'Options' area. Then select the Spectral Analysis Subresults tab that has been added.

Double-click the Scaled sums envelope item in the 'To Select' list to transfer it to the 'Selected' column (alternatively, select it and use the
![]() button).
button).
You can proceed in the same way for all other spectral analysis results. For the tutorial example, however, this shall not be done. Click Save and Show to apply the new setting. The number of pages is reduced significantly.
Printing Graphics
To add an image to the printout report, minimize the preview window by clicking the
![]() button on the 'Printout Report' title bar. The RFEM workspace reappears showing the global deformations resulting for the ULS design situation DS1 (see the
Deformations
image).
button on the 'Printout Report' title bar. The RFEM workspace reappears showing the global deformations resulting for the ULS design situation DS1 (see the
Deformations
image).
Open the list of load cases on the toolbar and select LC5 Modal analysis. To display the mode shapes (instead of the masses that were last set), select the Mode Shape option in the 'Navigator - Results'.

The mode shape related to the lowest natural frequency is displayed. Rotate and zoom the model for a good view. To print this image, click the
![]() button next to the
button next to the
![]() button on the toolbar. A list of printing options is opened.
button on the toolbar. A list of printing options is opened.
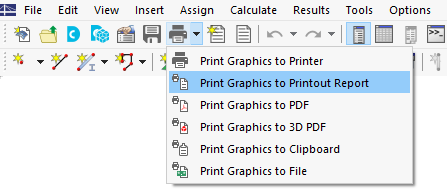
Click Print Graphics to Printout Report. The preview of the image is presented with some options to adjust the layout.

In the 'Graphic Pictures' area, select the Window filling arrangement. Click OK to print the image to the printout report.
Set the LC6 Spectral analysis load case next. The deformations resulting from the response spectrum analysis results are displayed. Set the Scaled sums envelope of results in the list (see the Results Available for Every Mode Shape and Direction image).

Click the
![]() button on the toolbar to print the spectral analysis results, too.
button on the toolbar to print the spectral analysis results, too.

In preview dialog box, select the Window filling arrangement again.
If you want to print more graphics, click 'OK' and proceed in the same manner. For the tutorial example, however, the two images shall be sufficient. Click Save and Show.
The printout report is created with the images on the last pages of the 'Modal Analysis Results' and 'Spectral Analysis Results' chapters.

Minimize the printout report again by clicking the
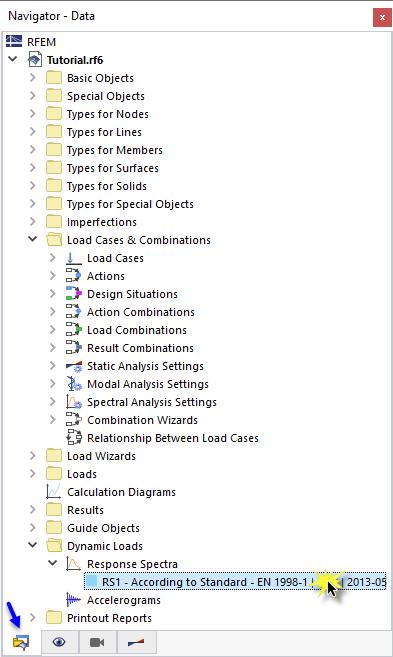
![]() button. To include the Response Spectrum in the documentation as well, set the Navigator - Data where you open the Dynamic Loads folder. Then double-click the RS1 item in the 'Response Spectra' category.
button. To include the Response Spectrum in the documentation as well, set the Navigator - Data where you open the Dynamic Loads folder. Then double-click the RS1 item in the 'Response Spectra' category.
The 'Edit Response Spectrum' dialog box is opened. Click the
![]() button next to the
button next to the
![]() button. Select the Print Graphics to Printout Report option.
button. Select the Print Graphics to Printout Report option.

The preview presents the acceleration-period diagram. When you have checked the settings, click Save and Show to print the image. The printout report is updated again with the diagram sorted into the 'Dynamic Loads' chapter.

Finally, close the printout report by clicking the
![]() button. Use the same button to close the 'Edit Response Spectrum' dialog box, too.
button. Use the same button to close the 'Edit Response Spectrum' dialog box, too.
Info
You have now completed the dynamic analysis part of the tutorial. Save the data by clicking the
![]() button on the toolbar.
button on the toolbar.


.png?mw=350&hash=c6c25b135ffd26af9cd48d77813d2ba5853f936c)


_1.jpg?mw=350&hash=ab2086621f4e50c8c8fb8f3c211a22bc246e0552)


