The Printout Report Manager provides all tables of the dynamic analysis that can be displayed in the program interface (see the image Selecting Dynamic Analysis Data ). Use the filters to customize the tabular output for your documentation. You have the following options:
- Object filter by number or object selection
- Result filter with the same filter options as in the Result Table Manager

For the documentation of the response spectrum analysis results, you can also define a filter for subresults.


.png?mw=350&hash=c6c25b135ffd26af9cd48d77813d2ba5853f936c)


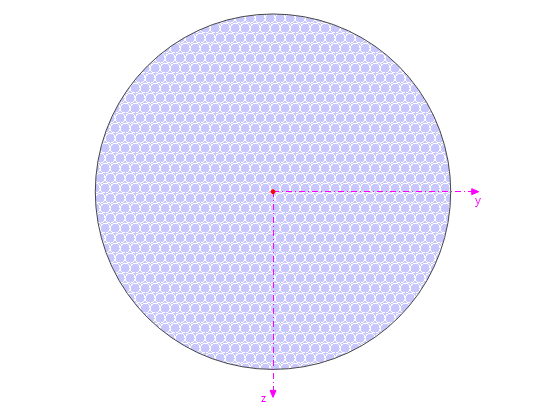
![Basic Shapes of Membrane Structures [1]](/en/webimage/009595/2419502/01-en-png-png.png?mw=512&hash=6ca63b32e8ca5da057de21c4f204d41103e6fe20)


.png?mw=512&hash=ea9bf0ab53a4fb0da5c4ed81d32d53360ab2820c)


_1.jpg?mw=350&hash=ab2086621f4e50c8c8fb8f3c211a22bc246e0552)


