基本设置
图形图片
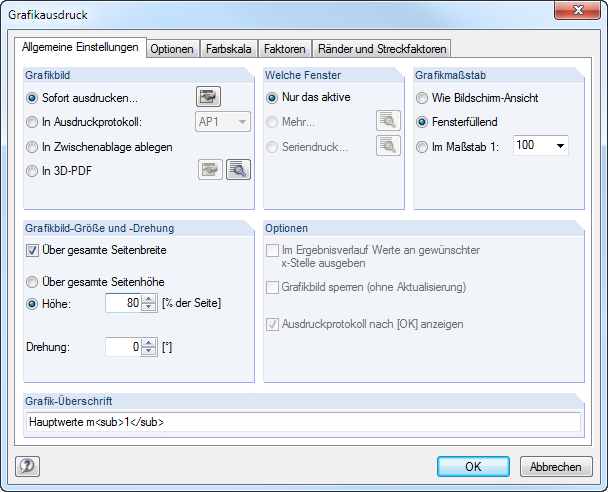
有四种图形输出选项:
- 将图形发送到打印机
- 到打印报告(见 章节10.1.5)
- In Zwischenablage ablegen
- 到三维 PDF
选择直接到打印机选项会直接进行打印。 Der Protokollkopf kann über die [Dialog öffnen]-Schaltflächen angepasst werden, die den Protokollkopf -Dialog aufruft (siehe Kapitel 10.1.4).
![]()
选择到打印报告选项,图形将被添加到从列表中选择的打印报告 Printout report(PR) 中。 如果没有打印报告可用,在确认该对话框后会出现新建打印报告对话框,在该对话框中您可以指定打印报告的描述和内容(见图 10.2)。
Die Zwischenablage stellt die Grafik anderen Programmen zur Verfügung.Dort kann die Grafik in der Regel über das Menü Bearbeiten → Einfügen übernommen werden.
Soll die Grafik als 3D-PDF abgelegt werden, so kann über die [Dialog öffnen]-Schaltflächen ebenfalls der Protokollkopf angepasst werden.
![]()
Die [Details]-Schaltflächen ruft den Dialog 3D PDF-Druckseite einrichten auf, in dem die Vorgaben für das Druckformat getroffen werden können.
![]()
您可以在Adobe 网站上找到有关3D PDF的更多信息。
待打印窗口
该部分控制如何处理打印输出中的多窗口视图显示。 如果选择只有当前选项则只打印当前窗口中显示的图形(例如图 10.46 中的右侧窗口)。
请注意,在打印多个图形窗口(见 章节 9.8)时,您只能将同一个模型的图形一起打印. 而不能跨模型进行打印。
Mit dem Aktivieren der Druckoption Mehr Fenster wird die [Details]-Schaltflächen zugänglich.
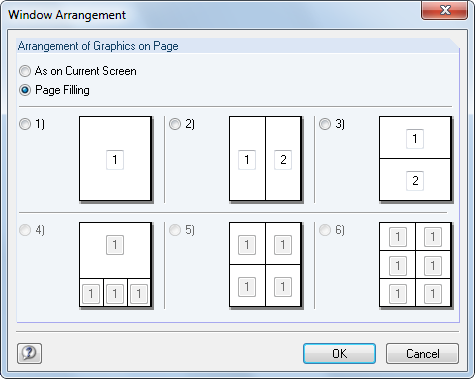
点击该按钮可以打开窗口排列的控制选项。
Wie auf Bildschirm arrangiert die Fenster so auf dem Blatt, wie sie den Größenverhältnissen auf dem Monitor entsprechen.In der Regel wird damit das Gesamtbild auf der Seite − wie auf dem Bildschirm − breiter als hoch.Bei der Option Blattfüllend wird die gesamte Seitengröße für die Darstellung der Fenster ausgenutzt.
Mit der Option Seriendruck lassen sich voreingestellte Standardgrafiken in das Ausdruckprotokoll integrieren.Nach dem Aktivieren des Auswahlfeldes und einem Klick auf [Details]-Schaltflächen erscheint ein neuer Dialog, in dem die Parameter festgelegt werden können (siehe Kapitel 10.2.6).
![]()
图形的大小
打印图形对话框的右上角部分(图 10.45)管理着纸上图形的图像比例。
Wie Bildschirmansicht verwendet den gleichen Darstellungsmaßstab wie auf dem Monitor. 这允许您打印缩放区域或特殊视图。
Die Option Fensterfüllend stellt die Gesamtgrafik auf dem Papier dar. 当前视角用于显示给定图形图片大小的整个模型(见下一个对话框部分)。
Im Maßstab druckt die Grafik in dem Maßstab, der in der Liste gewählt oder manuell eingegeben wird. 这里使用的是当前视角。 鸟瞰视图不适用于比例打印。
Grafikbild-Größe
这里的设置定义图形在页面上的大小。
Ist das Kontrollfeld Über gesamte Seitenbreite angehakt, wird wie im folgenden Bild gezeigt auch der linke Rand neben der vertikalen Trennlinie für die Grafik genutzt.
Soll nicht die ganze Seite für die Grafik genutzt werden, kann die Höhe des Grafikbereichs als Prozentwert der Seitenhöhe vorgegeben werden.
Der Drehwinkel im Eingabefeld Drehung rotiert die Grafik für den Ausdruck.
选项
Dieser Abschnitt ist im Kapitel 10.1.5 beschrieben. 对于打印结果图,您可以使用在结果图中显示所选 x 位置的结果选项,来决定是否打印出现在所选位置上的值(见图 9.20)。
图形标题
Beim Aufruf des Dialogs Grafikausdruck ist ein Titel für die Grafik voreingestellt, der in diesem Eingabefeld geändert werden kann.


