- Response spectra of numerous standards (ASCE 7-16, NBC 2015, etc.)
- User-defined response spectra or those generated from accelerograms
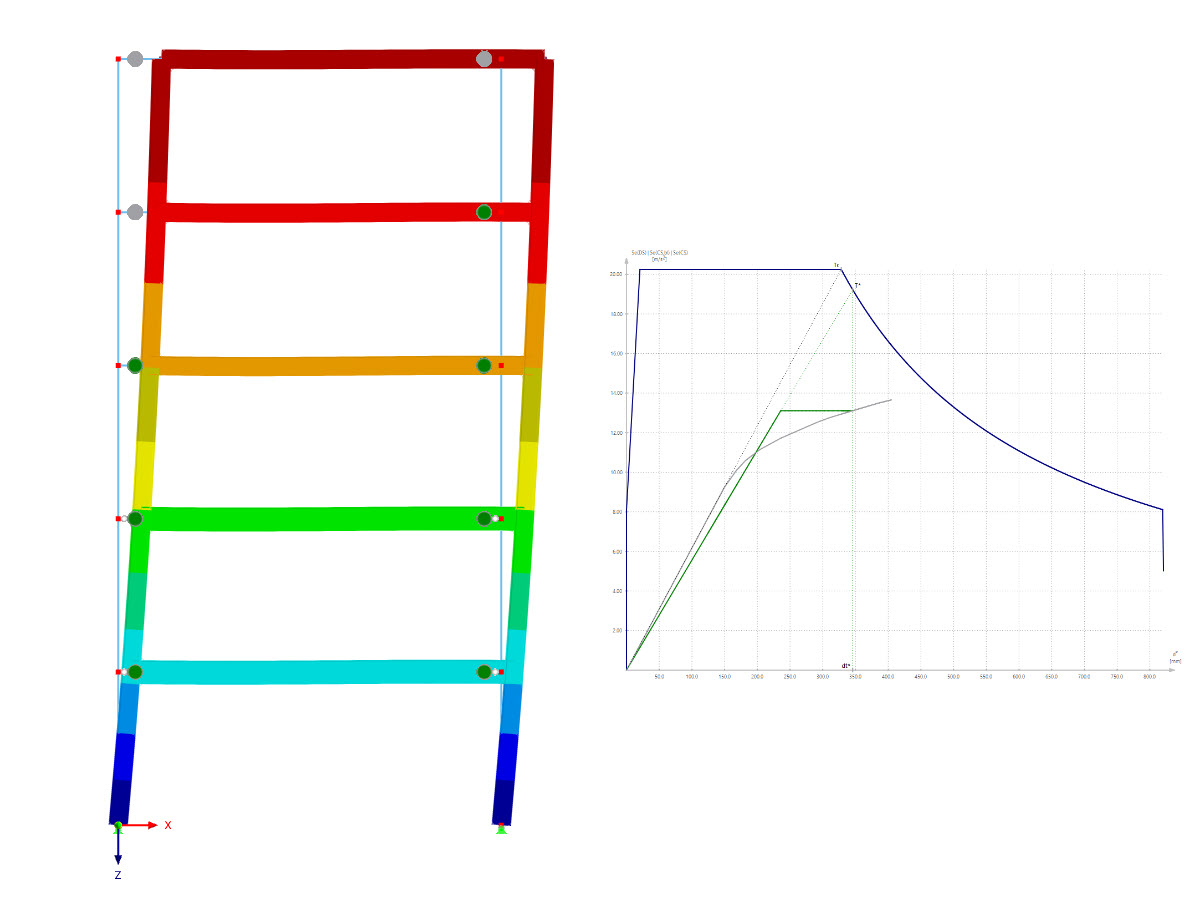
- Direction-relative response spectrum approach
- Manual or automatic selection of the relevant mode shapes of response spectra (5% rule of EC 8 applicable)
- Result combinations by modal superimposition (SRSS or CQC rule) and by direction superimposition (SRSS or 100% / 30% rule)
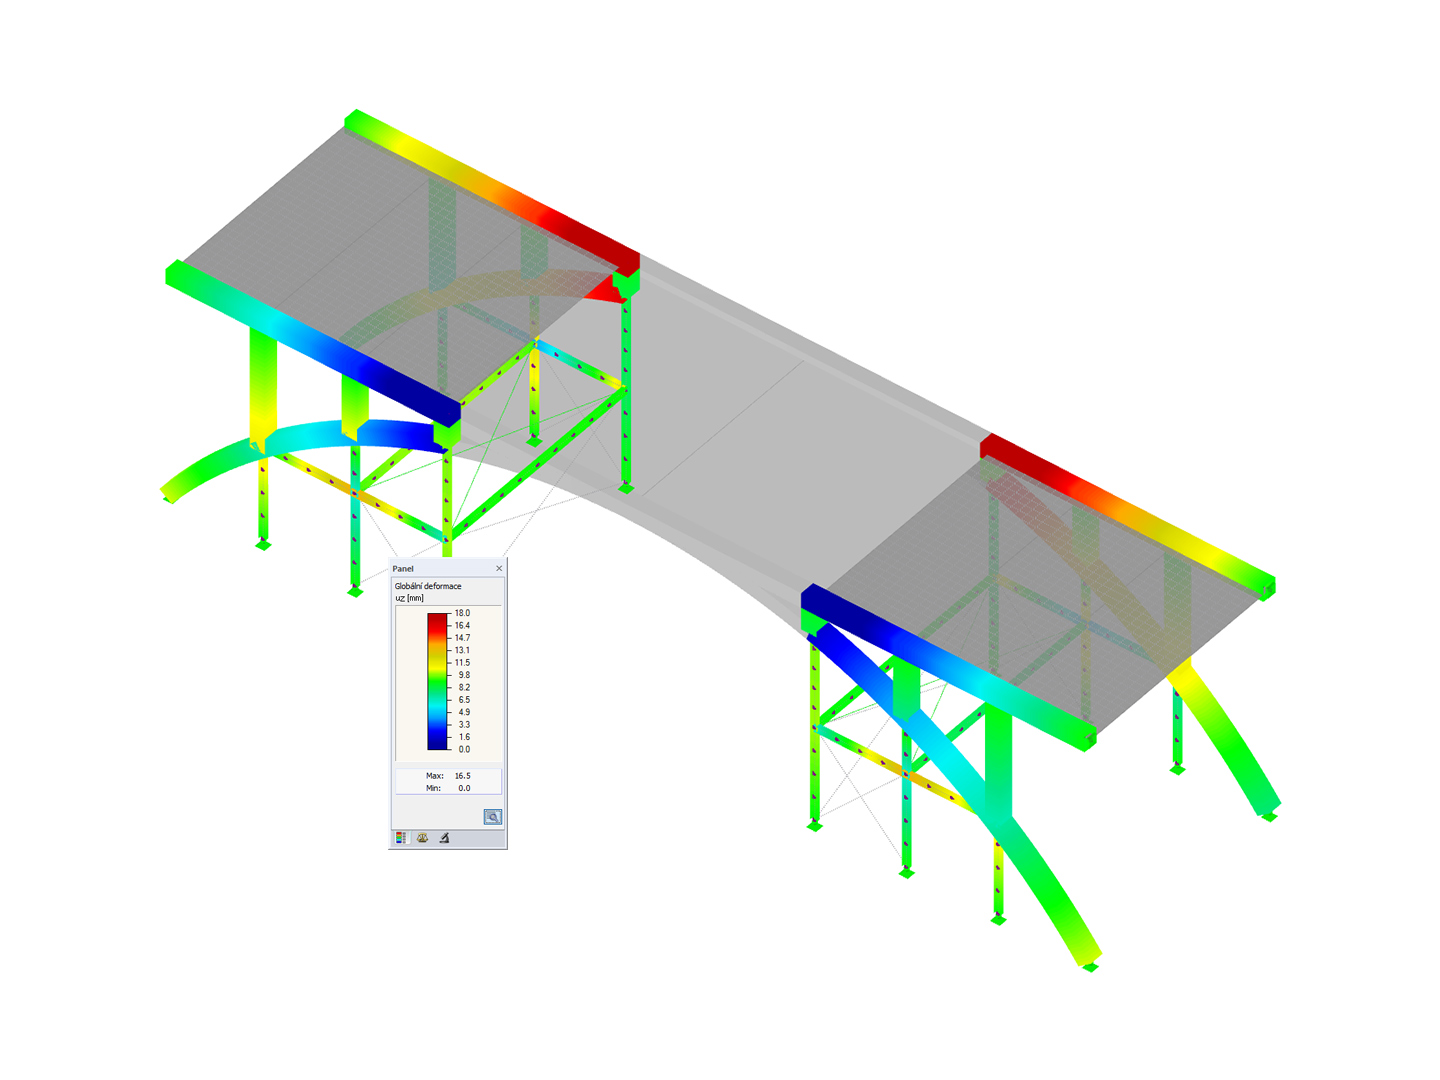
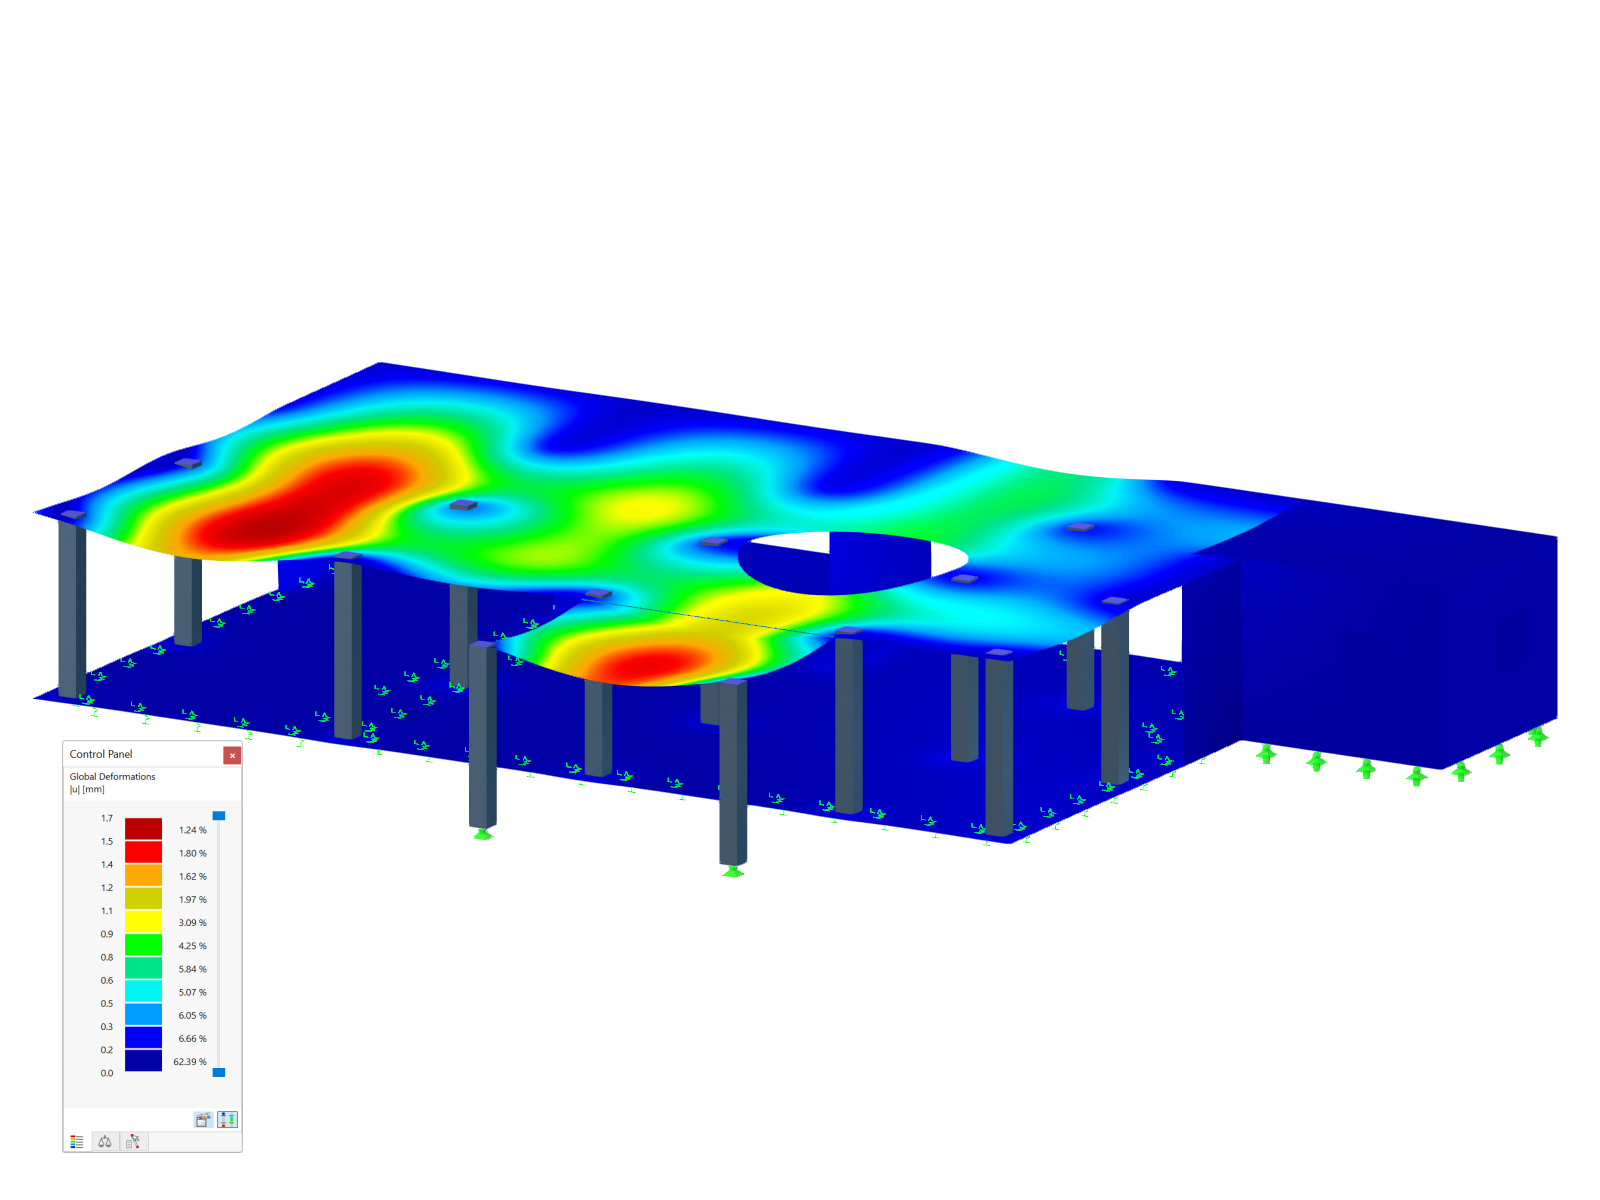
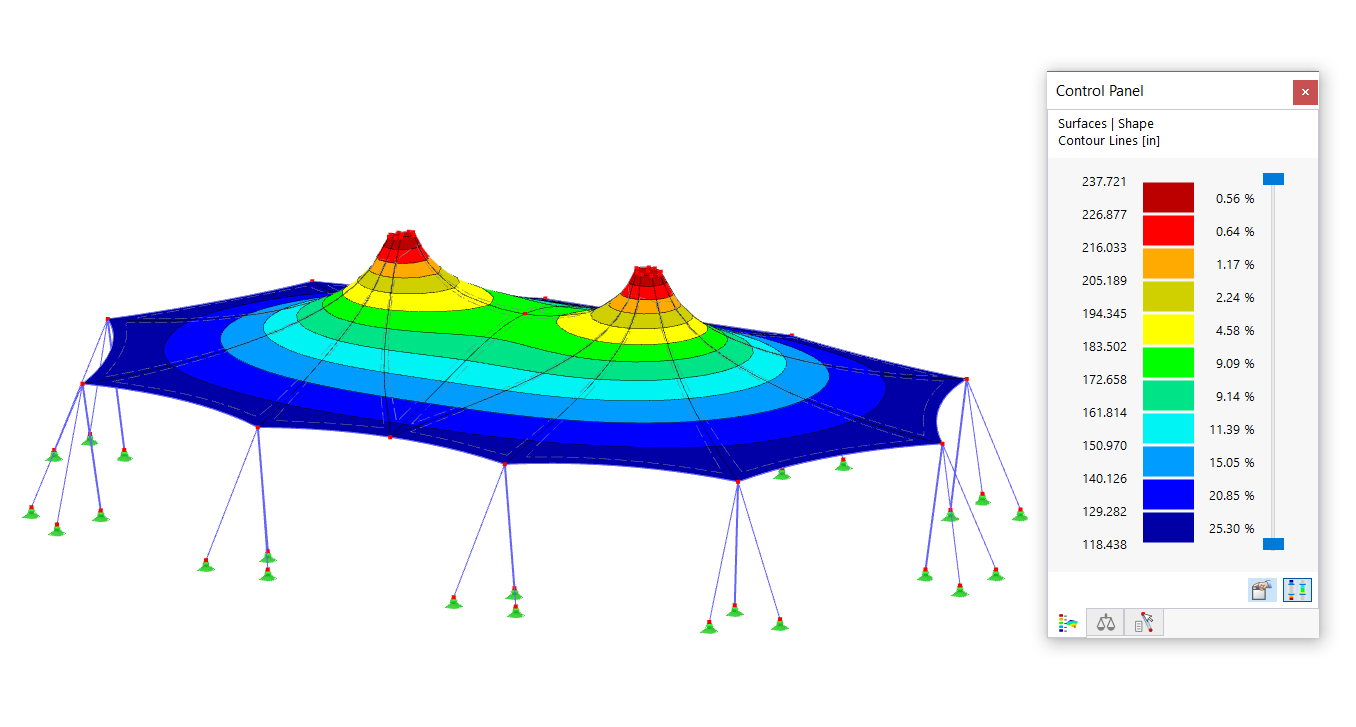
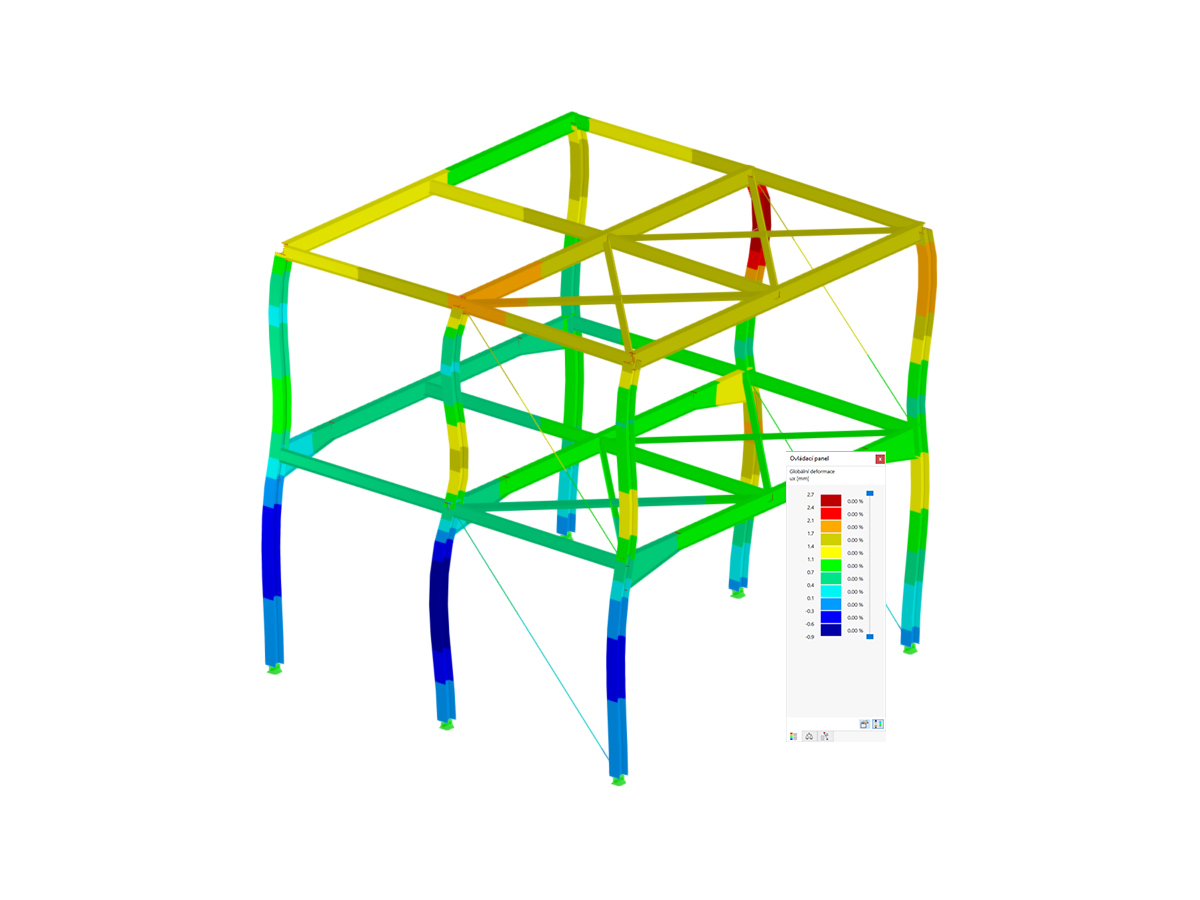
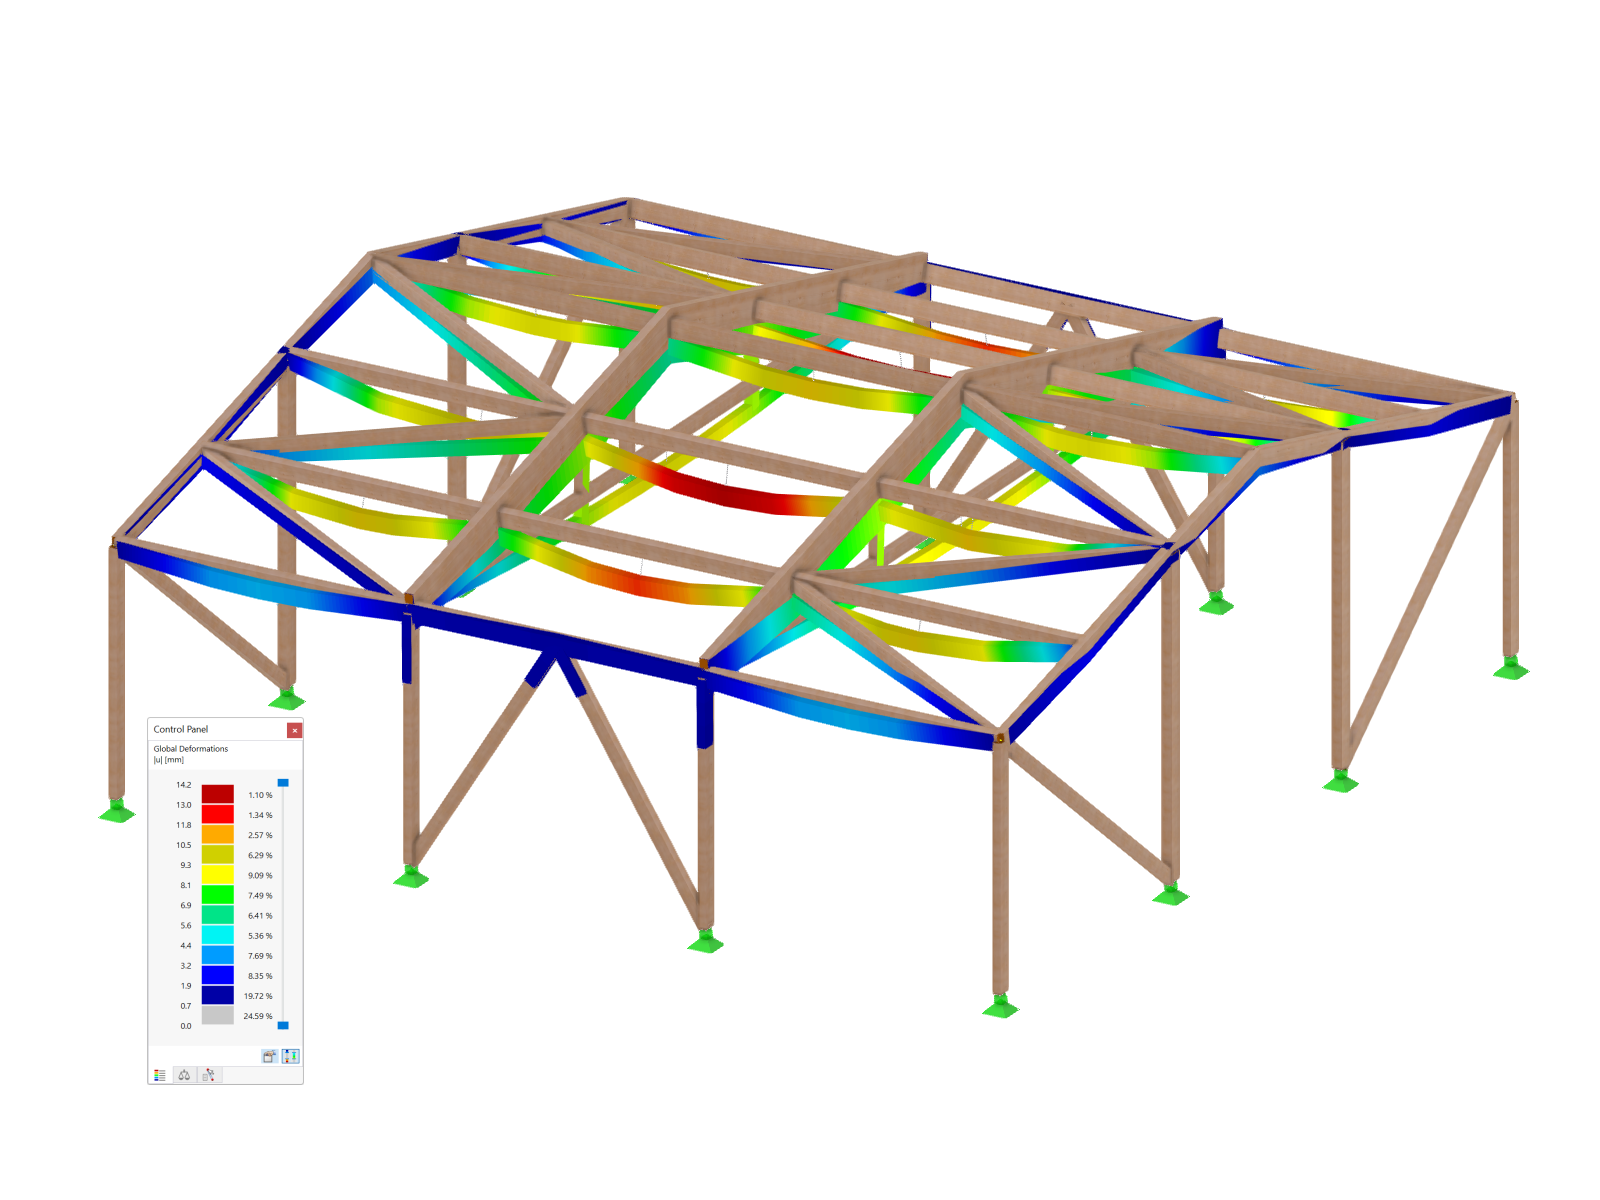
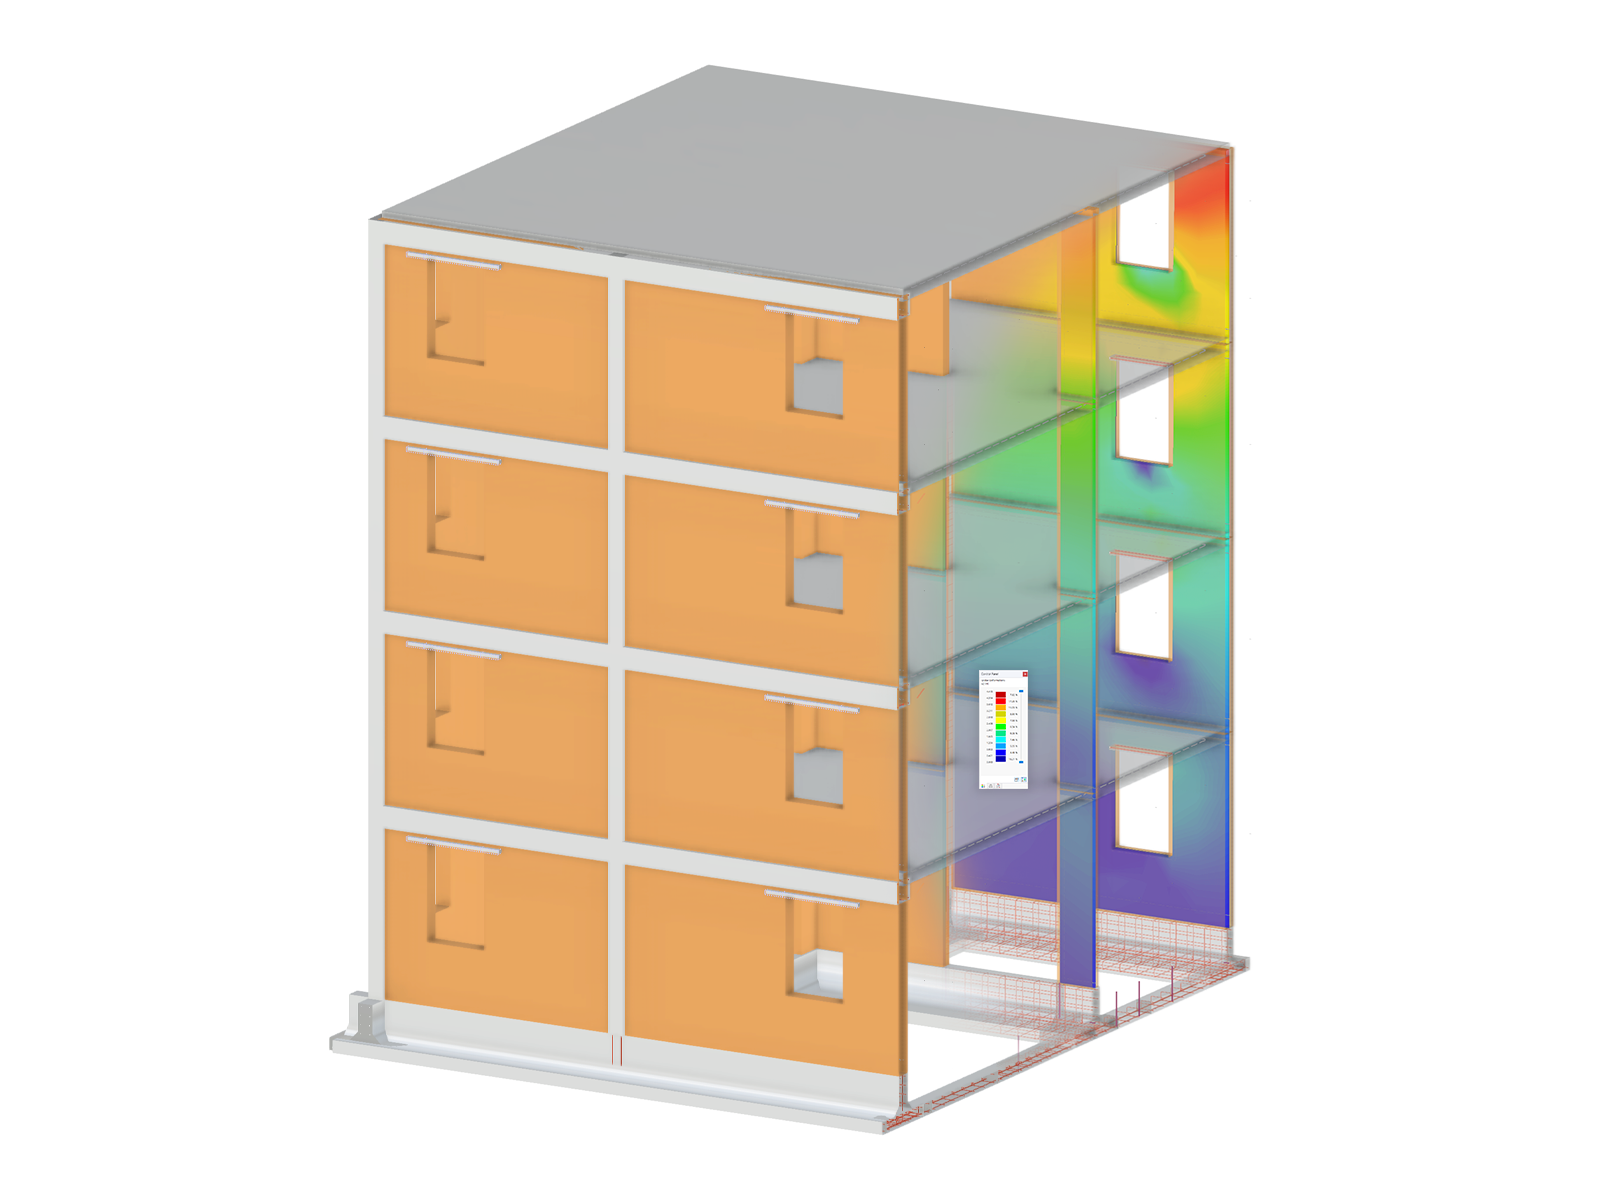
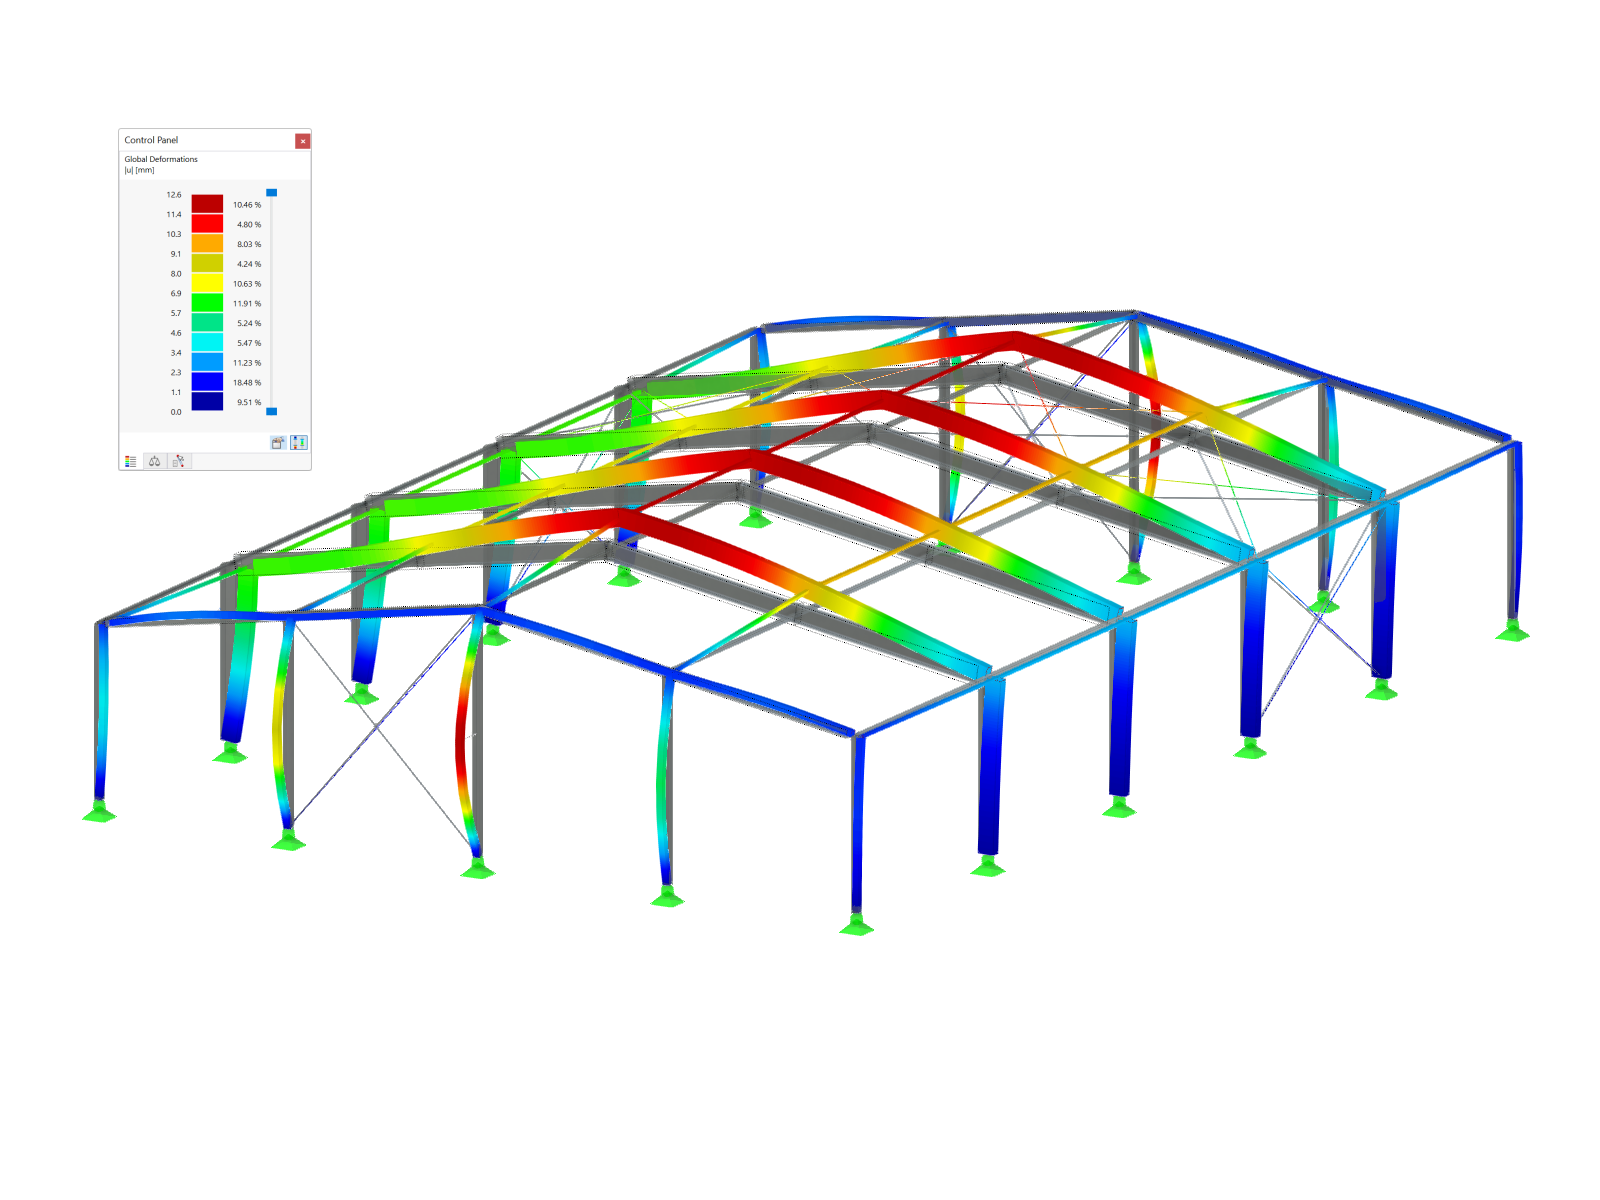
RF-/DYNAM Pro - Forced Vibrations | Features of Multi-Modal Response Spectrum Analysis


Duration: 01:10:25 min

Duration: 00:59:06 min

Duration: 01:08:55 min

Duration: 00:51:02 min

Duration: 00:01:06 min

Duration: 00:00:30 min

Duration: 00:01:11 min

Duration: 00:00:41 min

Duration: 00:00:52 min


This article provides an overview of the Dlubal-Tekla interface, detailing the export and import options, as well as the various workflows for efficiently managing data exchange between Tekla Structures and RFEM 6 in structural design and analysis.

This article explains how to simulate the thermal strain of members in RFEM 6 using temperature loads, covering both membrane and bending effects, with practical examples to demonstrate their application.

This article provides a detailed overview of the export features from RFEM 6 and RSTAB 9 to AutoCAD/DXF files, including options for exporting dimensions, FE meshes, and deformed shapes.

This article provides a detailed overview of the import features from RFEM 6 and RSTAB 9 to AutoCAD/DXF files.


In the Snow Load Wizard, you can optionally consider snow overhang and snow guard when generating snow loads according to Eurocode.

The Construction Stages Analysis (CSA) add-on allows you to modify the object and design properties of members, surfaces, and so on, in the individual construction stages.

In the wind simulation, it is possible to consider member coatings (for example, from ice loads).
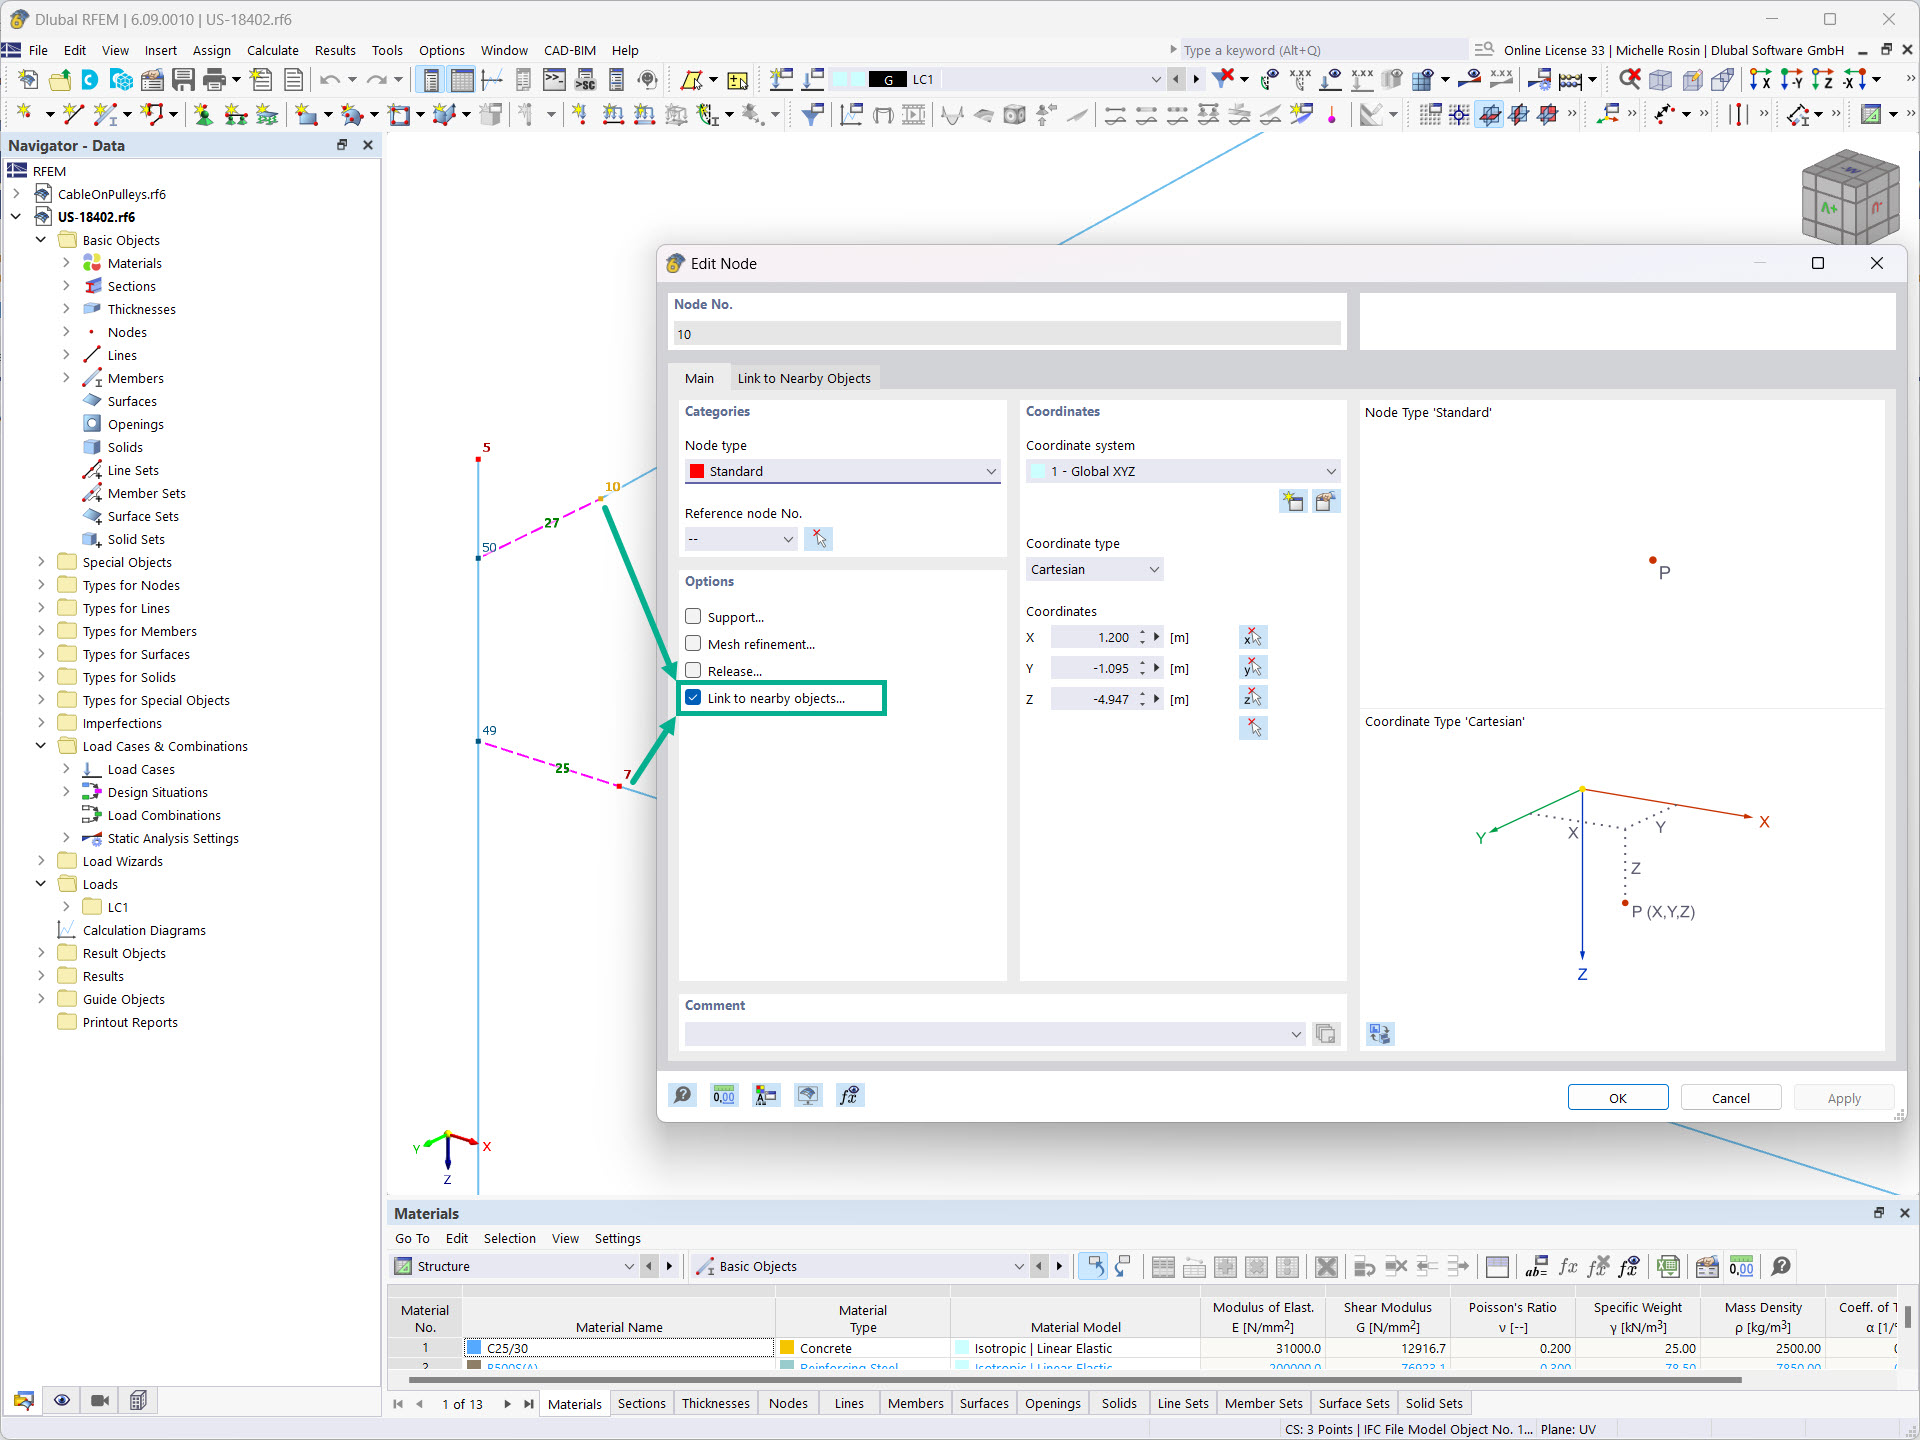
If you activate the "Link to Nearby Objects…" option for nodes, RFEM or RSTAB automatically searches for neighboring objects. A link in the form of a rigid member is then created for these members, nodes, or surfaces.
You can specify various settings for searching for nearby objects. Including search area, object types to be searched for, and objects to be excluded. Furthermore, you can specify member hinges for the created connecting member.
How can I calculate and read effective lengths of a member properly?
How can I find out which graphics card is actually used by RFEM 6?
I'm experiencing problems with the graphics card. What can I do?
Can I use the Dlubal API in Rhino and Grasshopper?
In the Steel Joints add-on, I get high utilization ratios for preloaded bolts in the tension design. Where do these high utilization ratios come from and how can I evaluate the load-bearing reserves of the bolt?
How can I transfer my model from ETABS to RFEM 6?


-querkraft-hertha-hurnaus.jpg?mw=350&hash=3306957537863c7a7dc17160e2ced5806b35a7fb)


Recommended Products for You
RFEM 6 | Main Program RFEM 6
The new generation of 3D FEA software is used for the structural analysis of members, surfaces, and solids.
Price of First License
4,790.00 USD
RFEM 6 | Design
The Steel Design add-on performs the ultimate and serviceability limit state design checks of steel members according to various standards.
Price of First License
2,970.00 USD
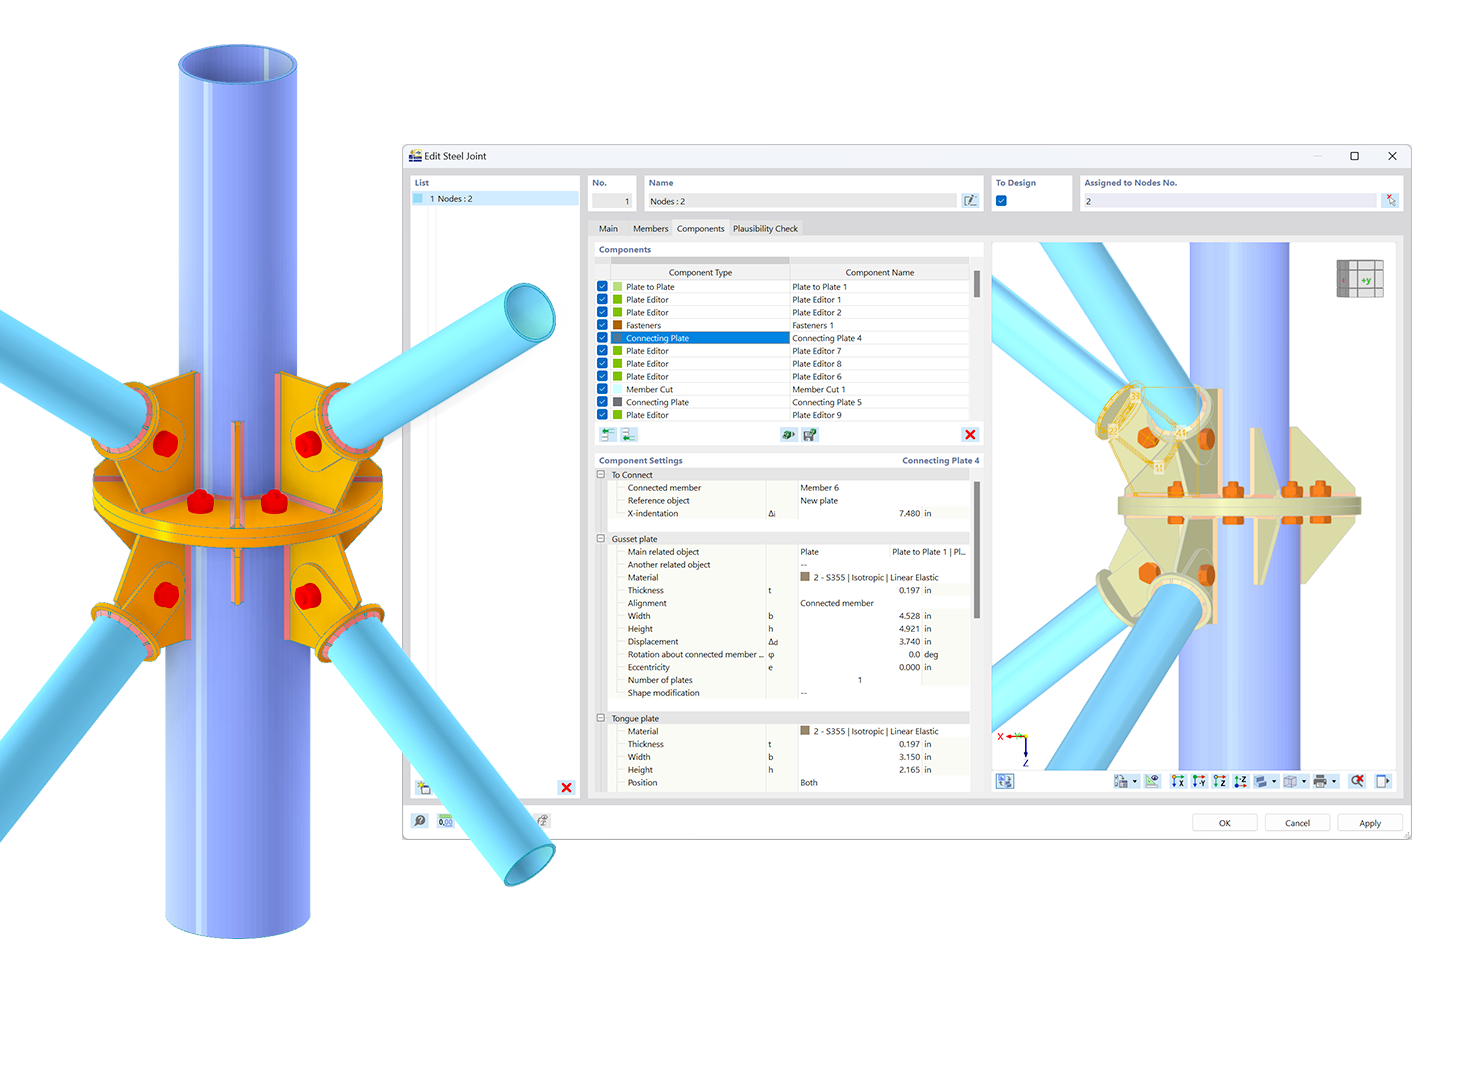
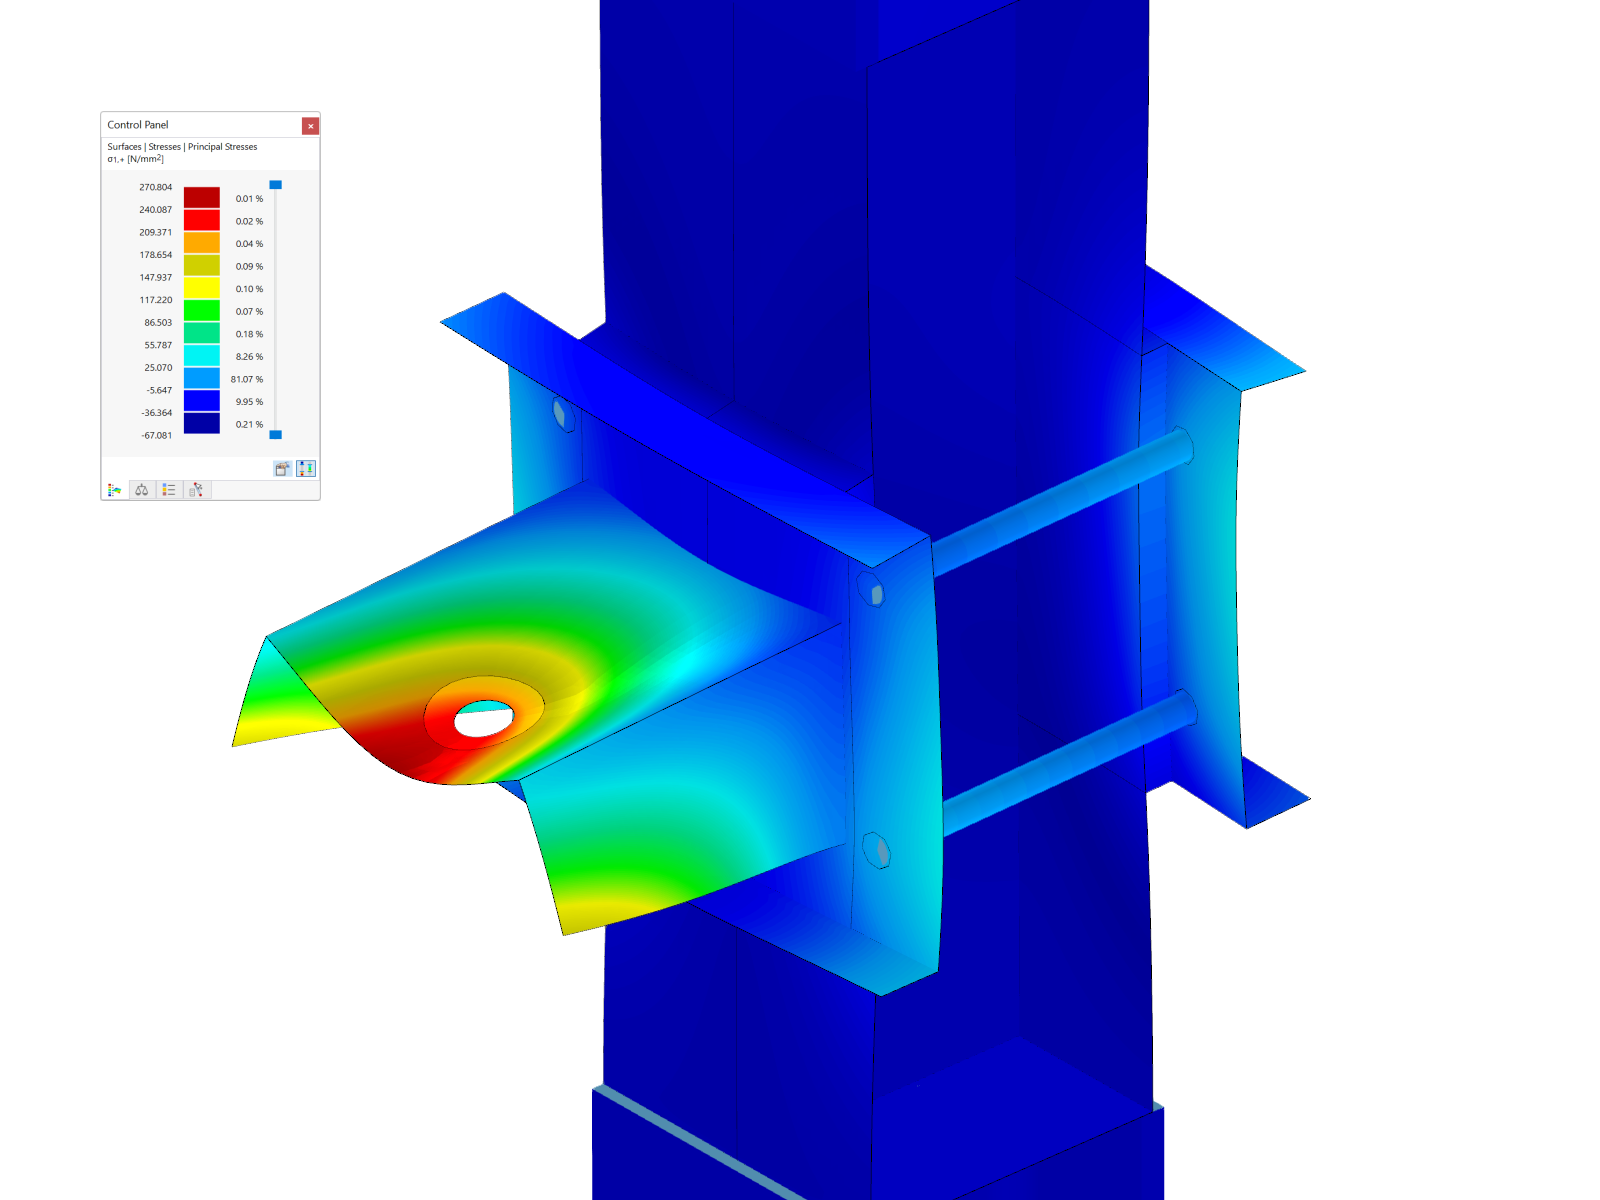
RFEM 6 | Joints
.png?mw=600&hash=49b6a289915d28aa461360f7308b092631b1446e)
The Steel Joints add-on for RFEM allows you to analyze steel connections using an FE model. The FE model is generated automatically in the background and can be controlled via the simple and familiar input of components.
Price of First License
2,670.00 USD
RFEM 6 | Additional Analysis
The Torsional Warping (7 DOF) add-on allows you to consider cross-section warping as an additional degree of freedom.
Price of First License
1,660.00 USD
RFEM 6 | Additional Analysis
The Nonlinear Material Behavior add-on allows you to consider material nonlinearities in RFEM for example, isotropic plastic, orthotropic plastic, isotropic damage).
Price of First License
1,660.00 USD
RFEM 6 | Additional Analysis
The Structure Stability add-on performs stability analysis of structures. It determines critical load factors and the corresponding stability modes.
Price of First License
1,460.00 USD
RFEM 6 | Additional Analysis
The Construction Stages Analysis (CSA) add-on allows for considering the construction process of structures (member, surface, and solid structures) in RFEM.
Price of First License
1,760.00 USD
RFEM 6 | Additional Analysis
The Time-Dependent Analysis (TDA) add-on allows you to consider the time-dependent material behavior of members and surfaces. The long-term effects, such as creep, shrinkage, and aging, can influence the distribution of internal forces, depending on the structure.
Price of First License
1,160.00 USD
RFEM 6 | Additional Analysis
The Form-Finding add-on finds the optimal shape of members subjected to axial forces and tension-loaded surface models. The shape is determined by the equilibrium between the member axial force or the membrane stress and the existing boundary conditions.
Price of First License
2,320.00 USD
RFEM 6 | Dynamic Analysis
The Modal Analysis add-on allows for the calculation of eigenvalues, natural frequencies, and natural periods for member, surface, and solid models.
Price of First License
1,360.00 USD
RFEM 6 | Dynamic Analysis
Using the Pushover Analysis add-on, you can analyze the seismic actions on a particular building, and thus assess whether the building can withstand an earthquake.
Price of First License
1,460.00 USD
RFEM 6 | Special Solutions

The Building Model add-on for RFEM allows you to define and manipulate a building using stories. The stories can be adjusted in many ways afterwards. The information about stories and the entire model (center of gravity) is displayed in tables and graphics.
Price of First License
1,970.00 USD
RFEM 6 | Design
The Stress-Strain Analysis add-on performs general stress analysis by calculating the existing stresses and comparing them with the limit stresses.
Price of First License
1,360.00 USD
RSTAB 9 | Main Program RSTAB 9
The modern 3D structural analysis and design program is suitable for the structural and dynamic analysis of beam structures as well as the design of concrete, steel, timber, and other materials.
Price of First License
3,380.00 USD
RSTAB 9 | Design
The Steel Design add-on performs the ultimate and serviceability limit state design checks of steel members according to various standards.
Price of First License
2,970.00 USD
RSTAB 9 | Additional Analysis
The Structure Stability add-on performs the stability analysis of structures. It determines critical load factors and the corresponding stability modes.
Price of First License
1,460.00 USD
RSTAB 9 | Design
The Stress-Strain Analysis add-on performs a general stress analysis by calculating the existing stresses and comparing them to the limit stresses.
Price of First License
1,260.00 USD
RSTAB 9 | Additional Analysis
The Torsional Warping (7 DOF) add-on allows for considering cross-section warping as an additional degree of freedom when calculating members.
Price of First License
1,660.00 USD
RSTAB 9 | Dynamic Analysis
The Modal Analysis add-on allows for the calculation of eigenvalues, natural frequencies, and natural periods for member, surface, and solid models.
Price of First License
1,360.00 USD
RSTAB 9 | Dynamic Analysis
Earthquakes may have a significant impact on the deformation behavior of buildings. A pushover analysis allows you to analyze the deformation behavior of buildings and compare them with seismic actions. Using the Pushover Analysis add-on, you can analyze the seismic actions on a particular building, and thus assess whether the building can withstand the earthquake.
Price of First License
1,460.00 USD
RFEM 6 | Design
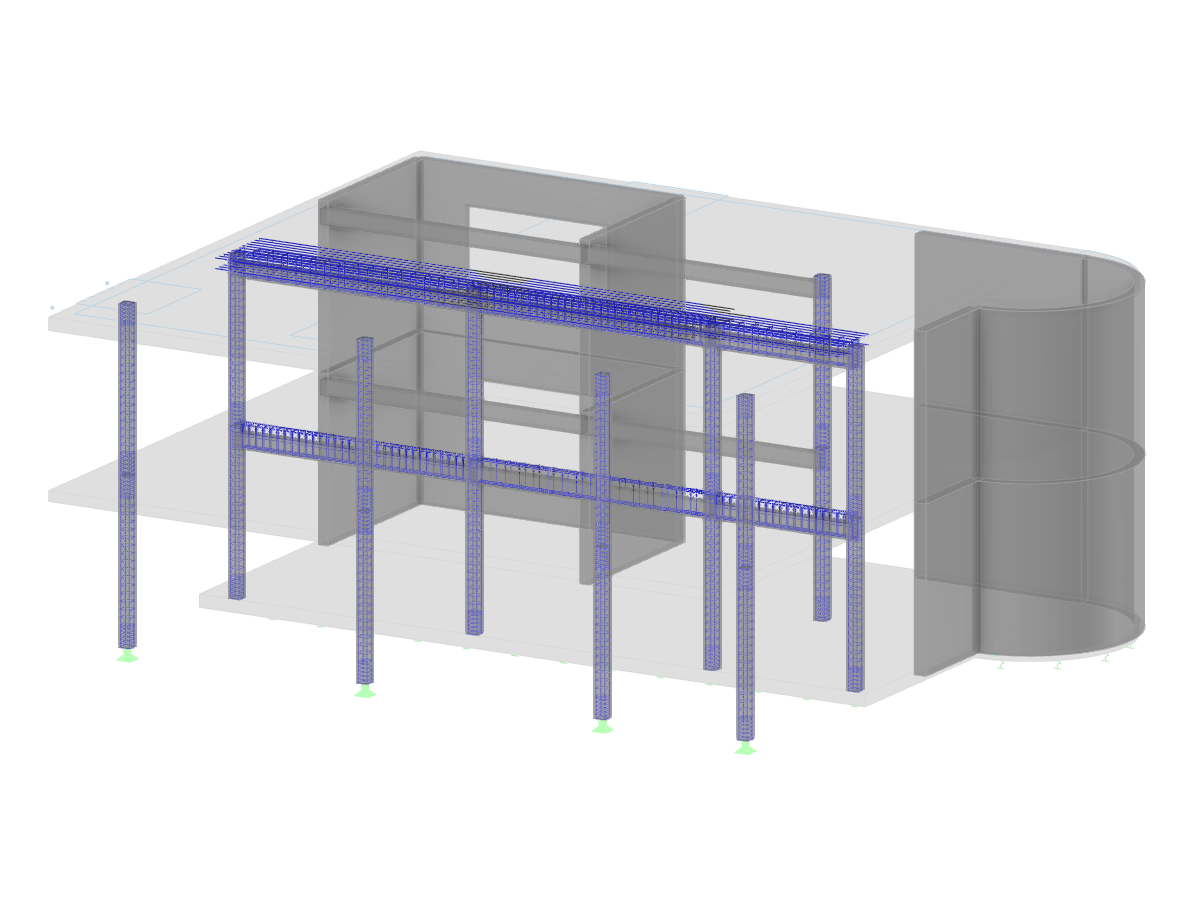
The Concrete Design add-on allows for various design checks according to international standards. You can design members, surfaces, and columns, as well as perform punching and deformation analyses.
Price of First License
2,970.00 USD
RFEM 6 | Design
The Timber Design add-on performs the ultimate, serviceability, and fire resistance limit state design checks of timber members according to various standards.
Price of First License
2,170.00 USD
RFEM 6 | Design
The Masonry Design add-on for RFEM allows you to design masonry using the finite element method. It was developed as part of the research project titled DDMaS – Digitizing the Design of Masonry Structures. The material model represents the nonlinear behavior of the brick-mortar combination in the form of macro-modeling.
Price of First License
1,860.00 USD
RFEM 6 | Design
The Aluminum Design add-on performs the ultimate and serviceability limit state design checks of aluminum members according to various standards.
Price of First License
1,970.00 USD
RSTAB 9 | Design
Concrete Design add-on allows for various design checks of members and columns according to international standards.
Price of First License
2,970.00 USD
RSTAB 9 | Design
The Timber Design add-on performs the ultimate, serviceability, and fire resistance limit state design checks of timber members according to various standards.
Price of First License
2,170.00 USD
RSTAB 9 | Design
The Aluminum Design add-on performs the ultimate and serviceability limit state design checks of aluminum members according to various standards.
Price of First License
1,970.00 USD