


RWIND 3 Pro umożliwia obliczanie Przepływu przejściowego, w obrębie wyświetlania wyników można wyświetlić wartości ekstremalne (wartości maks./min.) średnich ze wszystkich zapisanych przedziałów czasowych. A detailed description of the calculation can be found below in this chapter.
These results can be displayed either in the "Project Navigator - View" or in the "Edit Bar - Simulation" in the Display options section, see figure below.

The view can be reduced to individual models or parts of models (Zones) in "Mesh Sections", see image below.

Detailed values on a given model or model section can be displayed using "Mesh Section Information". Here you can find the "Max/Min in Time" values of the pressure and Cp coefficient, see image below.
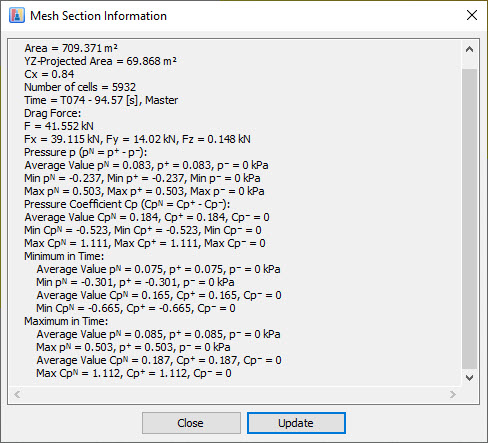
The value of the max/min in time is calculated by first calculating the average value of the quantity on the given area in the given time step (e.g. Average Value pN in the picture above). Then the max/min across all time steps is selected from these values and this is the "Max/Min in Time" quantity.
The description and formula for calculating the averages can be found in the Sections chapter.