How may I help you?
Do you have any questions about Dlubal products or need assistance in selecting the right one for your project?
I'm here to help. You can easily reach me through the contact options provided below.
Looking forward to hearing from you!
Amy Heilig, PE
CEO – USA Subsidiary | Sales Engineer


Linear and Nonlinear Structural Analysis, Result Evaluation, and Printout Report
Total items: 13

Individual Setting of Calculation Parameters
Select the individually suitable calculation parameters for your project: You can perform the calculation for all member types according to the linear static, second-order, or large deformation analysis. You have this selection option for load cases and load combinations. You can specifically set further calculation parameters for load cases, load combinations, and result combinations, which ensures a high degree of flexibility with regard to the calculation method and detailed specifications.

Optional Incremental Load Application
This feature helps you with the load application. You can have the required loading applied incrementally. This option is particularly suitable for your calculations according to the large deformation analysis. Furthermore, you can easily perform post‑critical analyses in RFEM.

Computation Kernel with Multi-Core Processor Technology
Convince yourself by the powerful calculation kernel, its optimized networking and support of multi-core processor technology. This provides you with the advantages, such as parallel calculations of linear load cases and load combinations using several processors without additional demands on the RAM. The stiffness matrix only has to be created once. Thus, you can calculate even large systems with the fast direct solver.
If you need to calculate multiple load combinations in your models, the program initiates several solvers in parallel (one per core). Each solver then calculates a load combination, which improves the core utilization.
You can systematically follow the development of the deformation displayed in a diagram during the calculation, and thus precisely evaluate the convergence behavior.
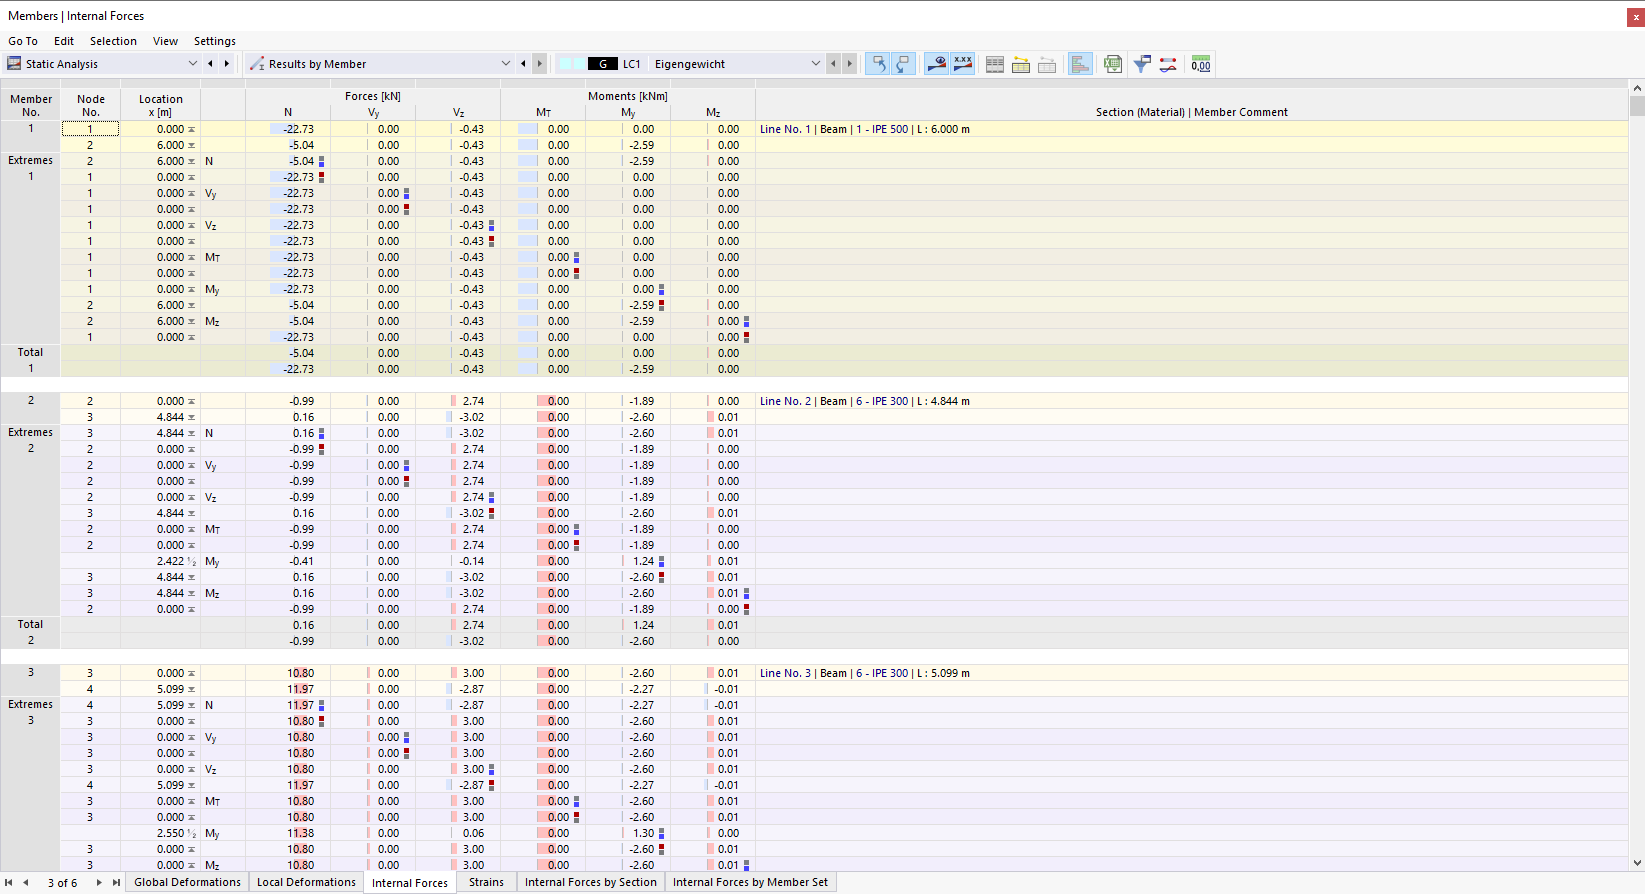
Color Representation of Internal Forces
Clear arrangement is a great advantage of RFEM 6. In your result tables, it is shown in color whether the internal forces are positive or negative, and what is the relation to the extreme values. Also in the graphic, you can recognize the positive or negative internal forces due to different colors. These colors can be changed, if necessary.

Result Diagrams
Customize the display of your data to your individual preferences. The result diagrams of members, surfaces (RFEM), and supports are freely configurable. You can define smooth ranges with average values or, if necessary, display and hide the result distributions. This ensures targeted evaluation of your results. Furthermore, you can easily add all diagrams to the printout report.


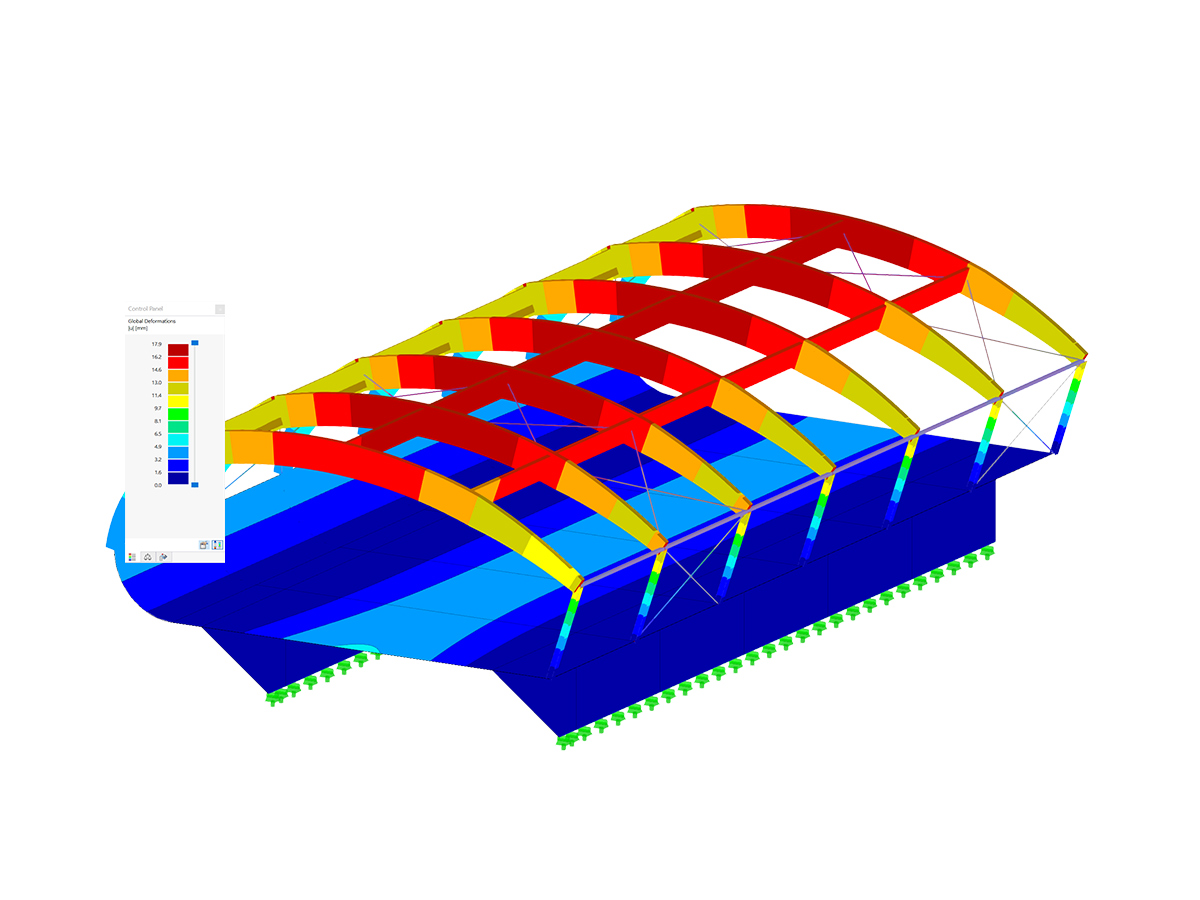
Visualization of Results
Also on the rendered model, you see your results in a clear color display. Thus, you can exactly recognize the rotation of a member or the stress distribution in a surface, for example. If you want to set the colors and value ranges, you can easily do so in the control panel.

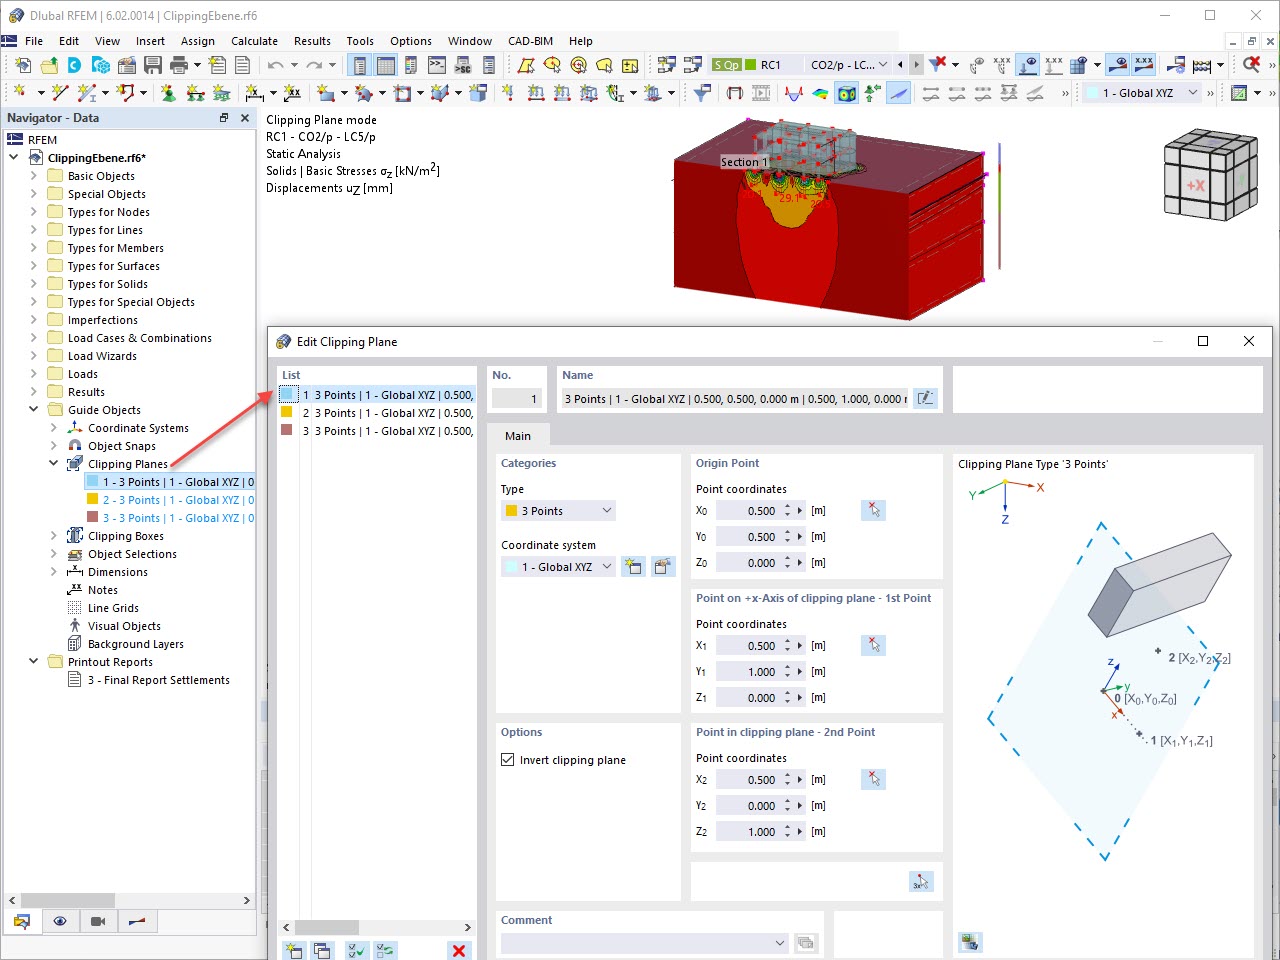
Result Display via Clipping Plane
This feature also contributes to the clearly-arranged display of your results. Clipping planes are intersecting planes that you can place freely throughout the model. The zone in front of or behind the plane is consequently hidden in the display. This way, you can clearly and simply show the results in an intersection or a solid, for example.

Detailed Result Tables
With clearly arranged tables, you can always keep an eye on your results. The first result table displays a summarized overview providing the equilibrium of forces in the structural system and the maximum deformations. Moreover, you also get the information about the calculation process. You can filter the result tables by specific criteria, such as extreme values or design locations, in order to obtain a better overview.

Output of Design Check Formulas
With Dlubal Software, you always have an overview, regardless of whether your projects are from the reinforced concrete, steel, timber, aluminum, or other industry. The program clearly displays the design check formulas used in your design (including a reference to the used equation from the standard). These design check formulas can also be included in the printout report.
Go to Explanatory Video
Creating Calculation Diagrams
Do you want to create calculation diagrams? With RFEM and RSTAB, this works globally and without any problems. Create and organize your calculation diagrams directly in the Navigator - Data or via the menu Insert → Calculation Diagrams.
Use calculation diagrams to record and display a relation between the various calculation results.
It is also possible to superimpose similar diagrams.

Multi Print of Graphics
Use the mass print function for your model data, loads, and results. You can create graphics from different directions that you define. For example, you can print all internal forces as an isometric view with just a single mouse click.
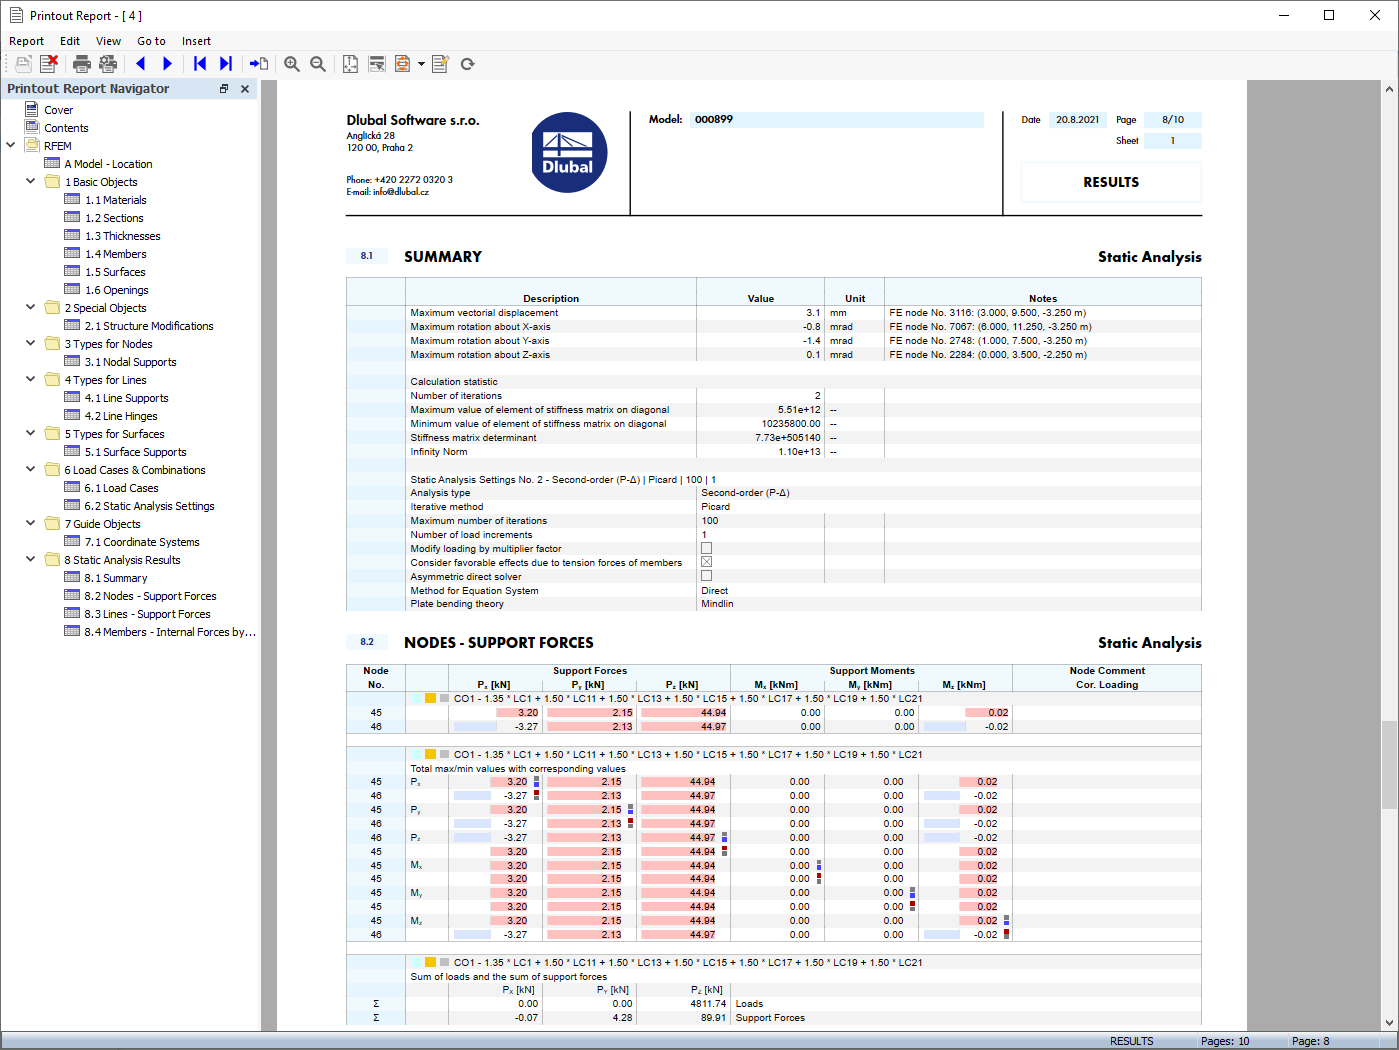
Multilingual Report Output
Of course, RFEM 6 also offers extensive language settings for our customers from all over the world. Various languages are available for the results in your printout report: English, German, French, Spanish, Portuguese, Italian, Czech, Polish, Russian, and Chinese. You can create further language versions individually.
You can easily import additional texts. Configure the page numbering to use prefixes, for example. Furthermore, you can export the report as a PDF file.

Management of Printout Report Scope
Decide for yourself how extensive your printout should be and adjust it individually using the selection criteria. Simply create printout templates from the existing projects. You can reuse them across your projects.
Calculate Your Price
Total Amount 4,790.00 USD
The price is valid for United States.


Duration: 01:06:17 min

Duration: 01:07:14 min

Duration: 00:49:22 min

Duration: 00:27:21 min

Duration: 01:06:45 min

Duration: 01:01:07 min

Duration: 00:29:07 min
.png?mw=350&hash=c6c25b135ffd26af9cd48d77813d2ba5853f936c)
Duration: 00:02:51 min

Duration: 00:44:46 min


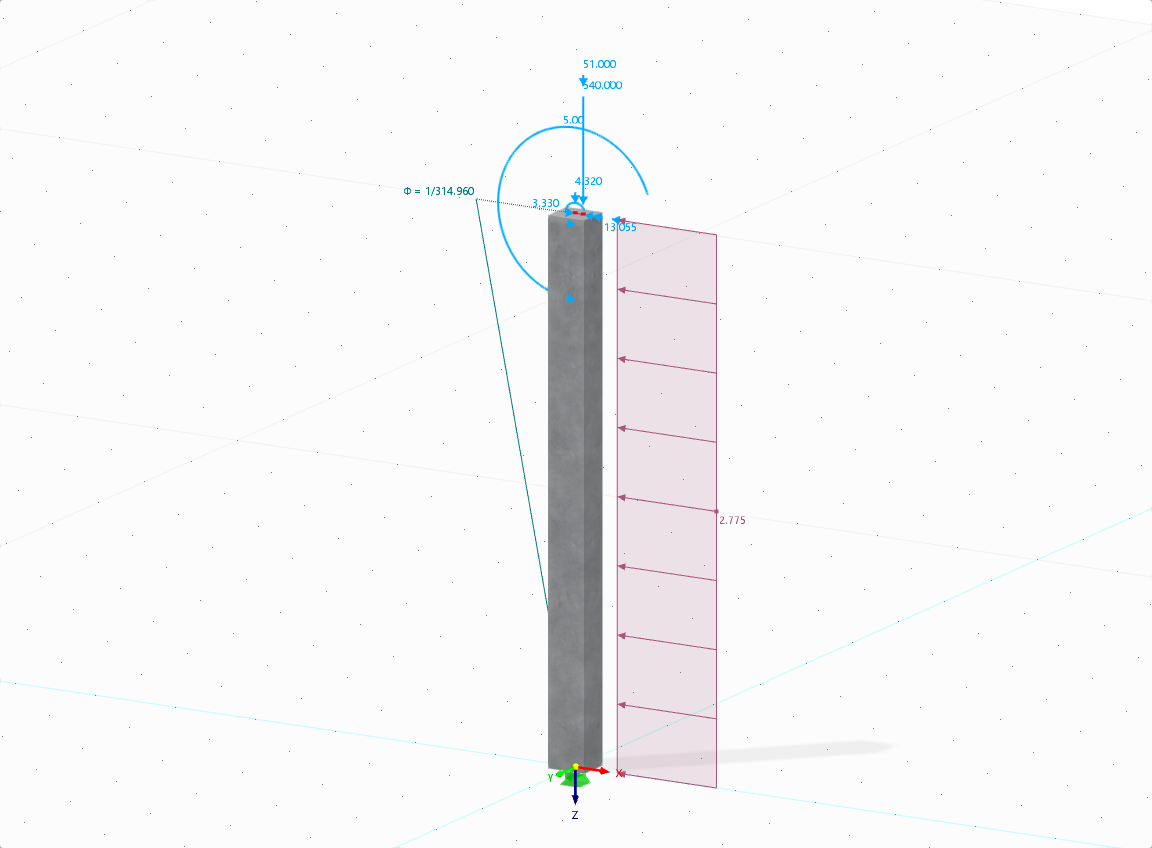
For reinforced concrete components and structures with structural behavior considerably influenced by the effects of the second-order analysis, Eurocode 2 provides the general method based on a nonlinear determination of internal forces according to the second-order analysis (5.8.6), as well as the approximation method based on the nominal curvature (5.8.8).
The aim of this technical article is to perform a design according to the general design method of Eurocode 2, using the example of a slender reinforced concrete column.
The aim of this technical article is to perform a design according to the general design method of Eurocode 2, using the example of a slender reinforced concrete column.

This technical article addresses the direct deformation analysis of reinforced concrete beams considering the long-term effects of creep and shrinkage. The direct calculation according to Eurocode 2 (EN 1992-1-1, Section 7.4.3) is explained using a single-span beam. Particular emphasis is placed on tension stiffening, behavior in the cracked state based on the distribution factor (damage parameter), and consideration of shrinkage and creep behavior.
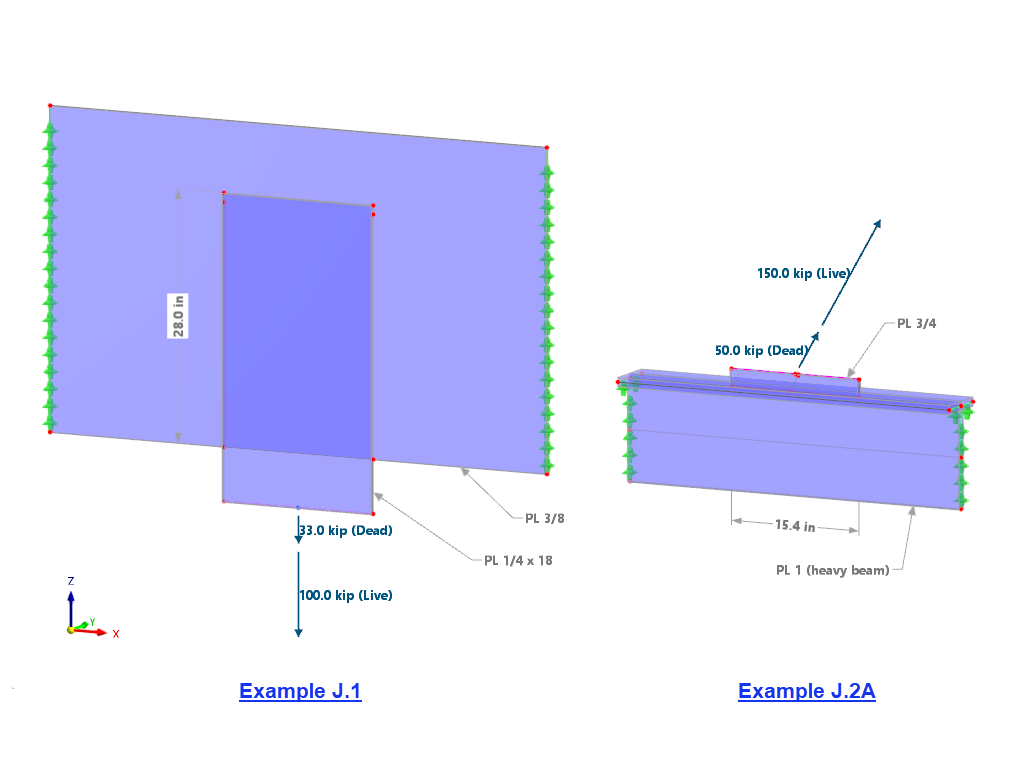
The weld stresses between surfaces can be determined using the Stress-Strain Analysis add-on in RFEM 6. Furthermore, the stress limit determined according to the applicable standard can be input to determine the stress ratio of the weld. This article focuses on the fillet weld design according to AISC 360-22 [1] with two examples from AISC Volume 1: Design Examples [2].

In this article, we will explore the various types of stability failures, delving into their key features, causes, and how they manifest in different structural systems.


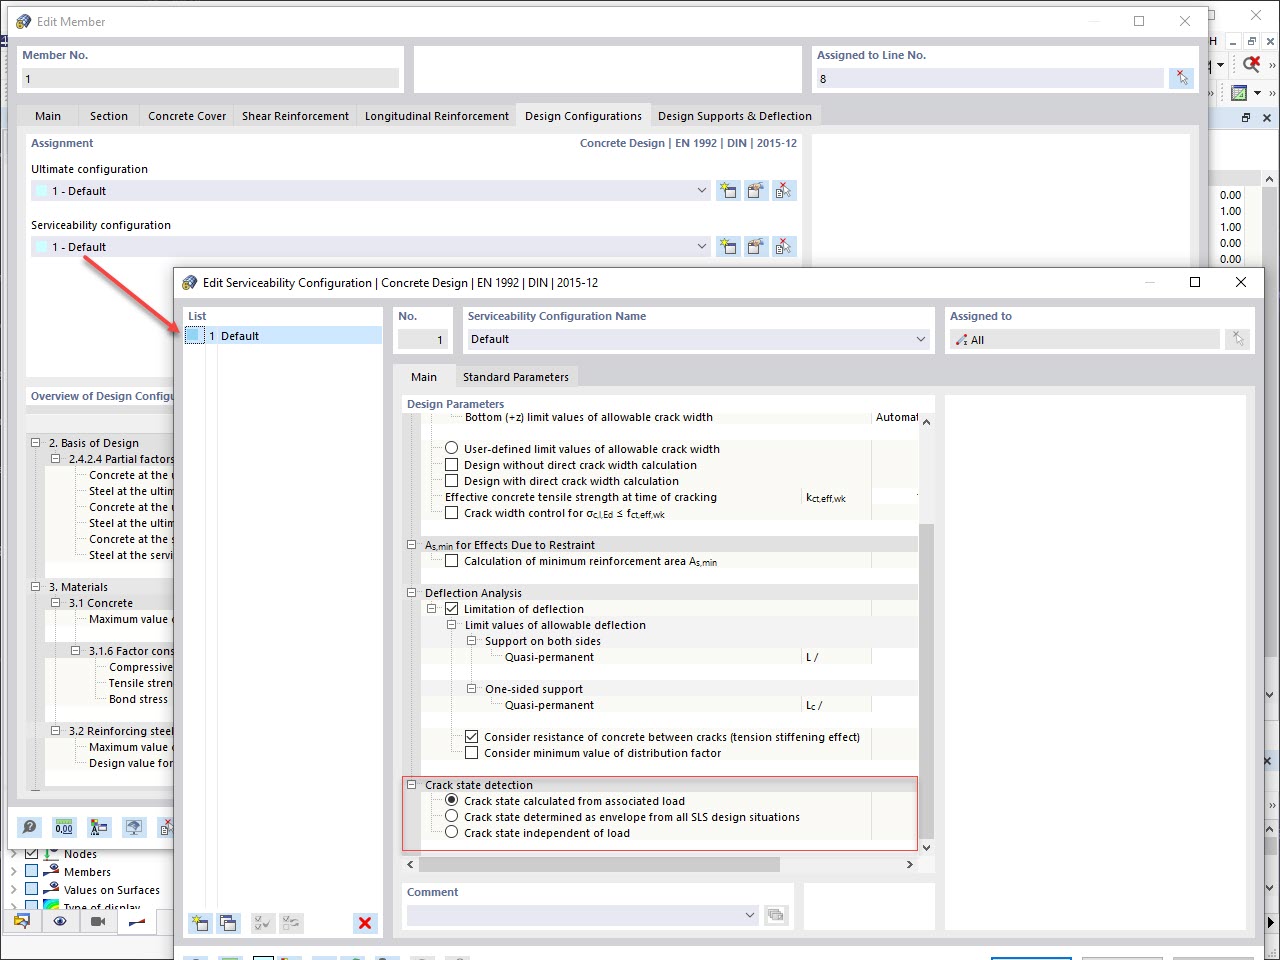
Various design parameters of the cross-sections can be adjusted in the serviceability limit state configuration. The applied cross-section condition for the deformation and crack width analysis can be controlled there.
For this, the following settings can be activated:
- Crack state calculated from associated load
- Crack state determined as an envelope from all SLS design situations
- Cracked state of cross-section - independent of load
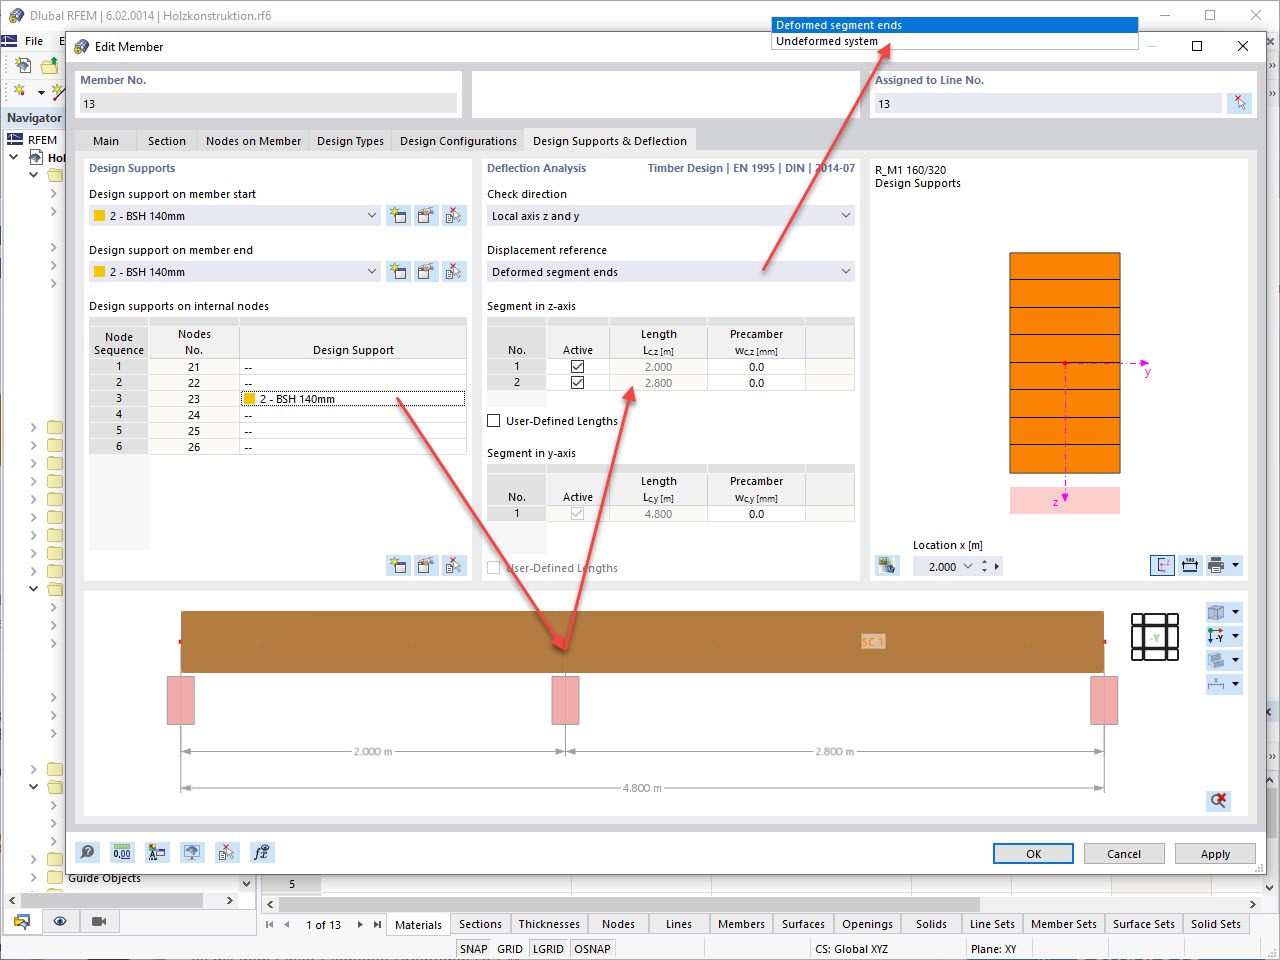
In the "Deflection and Design Support" tab under "Edit Member", the members can be clearly segmented using optimized input windows. Depending on the supports, the deformation limits for cantilever beams or single-span beams are used automatically.
By defining the design support in the corresponding direction at the member start, member end, and intermediate nodes, the program automatically recognizes the segments and segment lengths to which the allowable deformation is related. It also automatically detects whether it is a beam or a cantilever due to the defined design supports. The manual assignment, as in the previous versions (RFEM 5), is no longer necessary.
The "User-Defined Lengths" option allows you to modify the reference lengths in the table. The corresponding segment length is always used by default. If the reference length deviates from the segment length (for example, in the case of curved members), it can be adjusted.
This feature also contributes to the clearly-arranged display of your results. Clipping planes are intersecting planes that you can place freely throughout the model. The zone in front of or behind the plane is consequently hidden in the display. This way, you can clearly and simply show the results in an intersection or a solid, for example.

The deformation process of the global deformation components can be represented as a movement sequence.
My model is unstable. What could be the reason?
Can I optimize parametric cross-sections?
How can I check the determination of the required reinforcement?
Is it possible to consider shear panels and rotational restraints in the global calculation?
How can I create a nodal constraint of the "Diaphragm" type in RFEM 6, as the function "1.31 – Nodal Constraints" from RFEM 5 is no longer available?
Do I need to add a line hinge/line release for the CLT wall-to-floor connection in the Building Model add-on?


