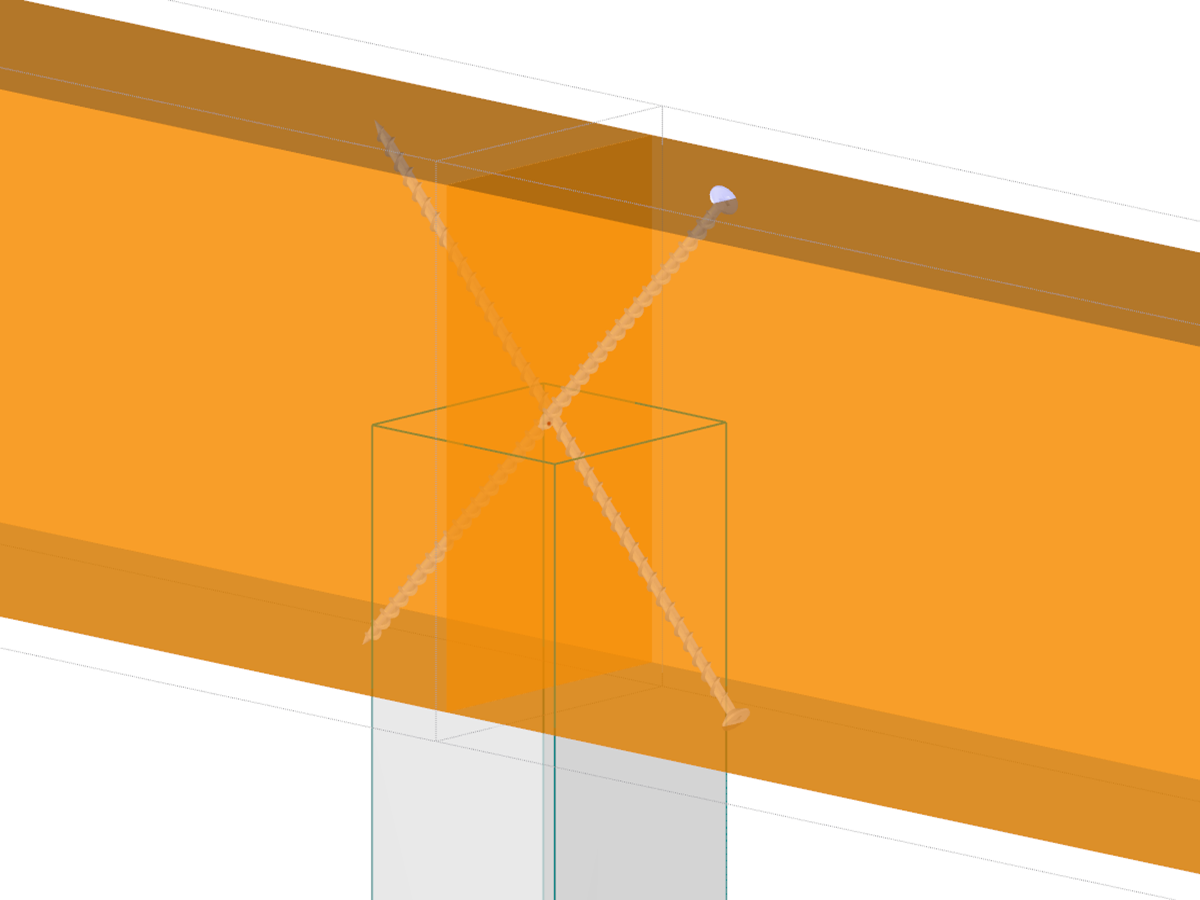
At first, the governing joint designs are arranged in groups and displayed with the basic geometry of the joint in the first result window. In the other result windows, you can see all fundamental design details.
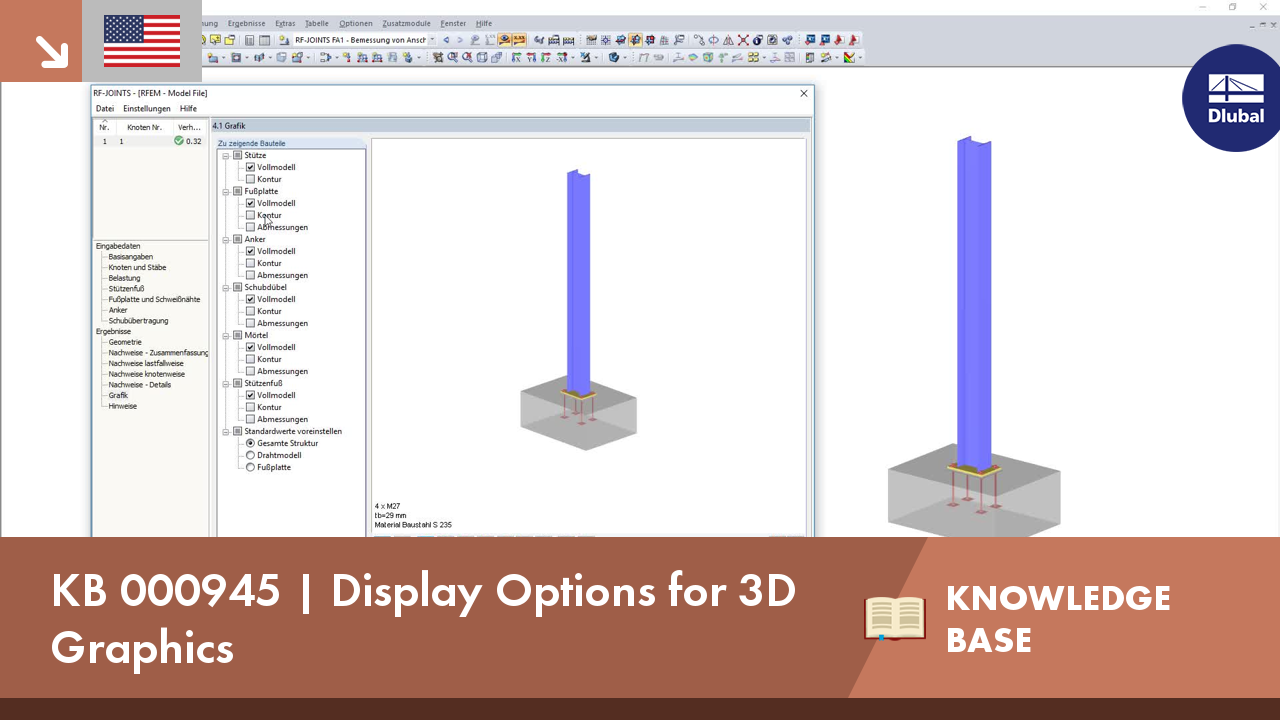
Dimensions, material properties, and welds important for the connection construction are displayed immediately and can be printed directly. Similarly, export to DXF-file is enabled. The connections can be visualized in the RF-/JOINTS Timber - Timber to Timber module as well as in RFEM/RSTAB.
All graphics can be included in the RFEM/RSTAB printout report or printed directly. Due to the scaled output, an optimal visual check is possible as early as in the design phase.


.png?mw=512&hash=8c5302ae04d7a2024cab77b7f047eafc1f238334)