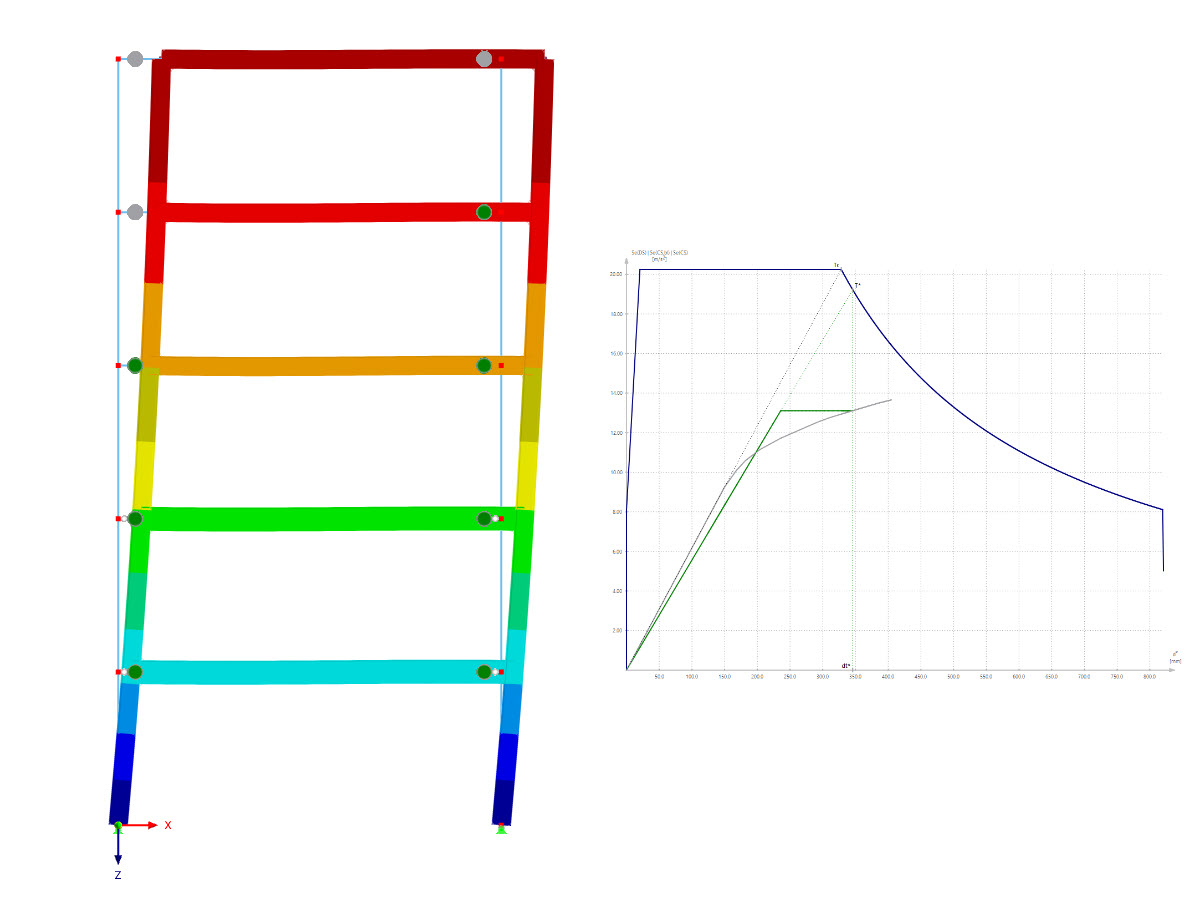
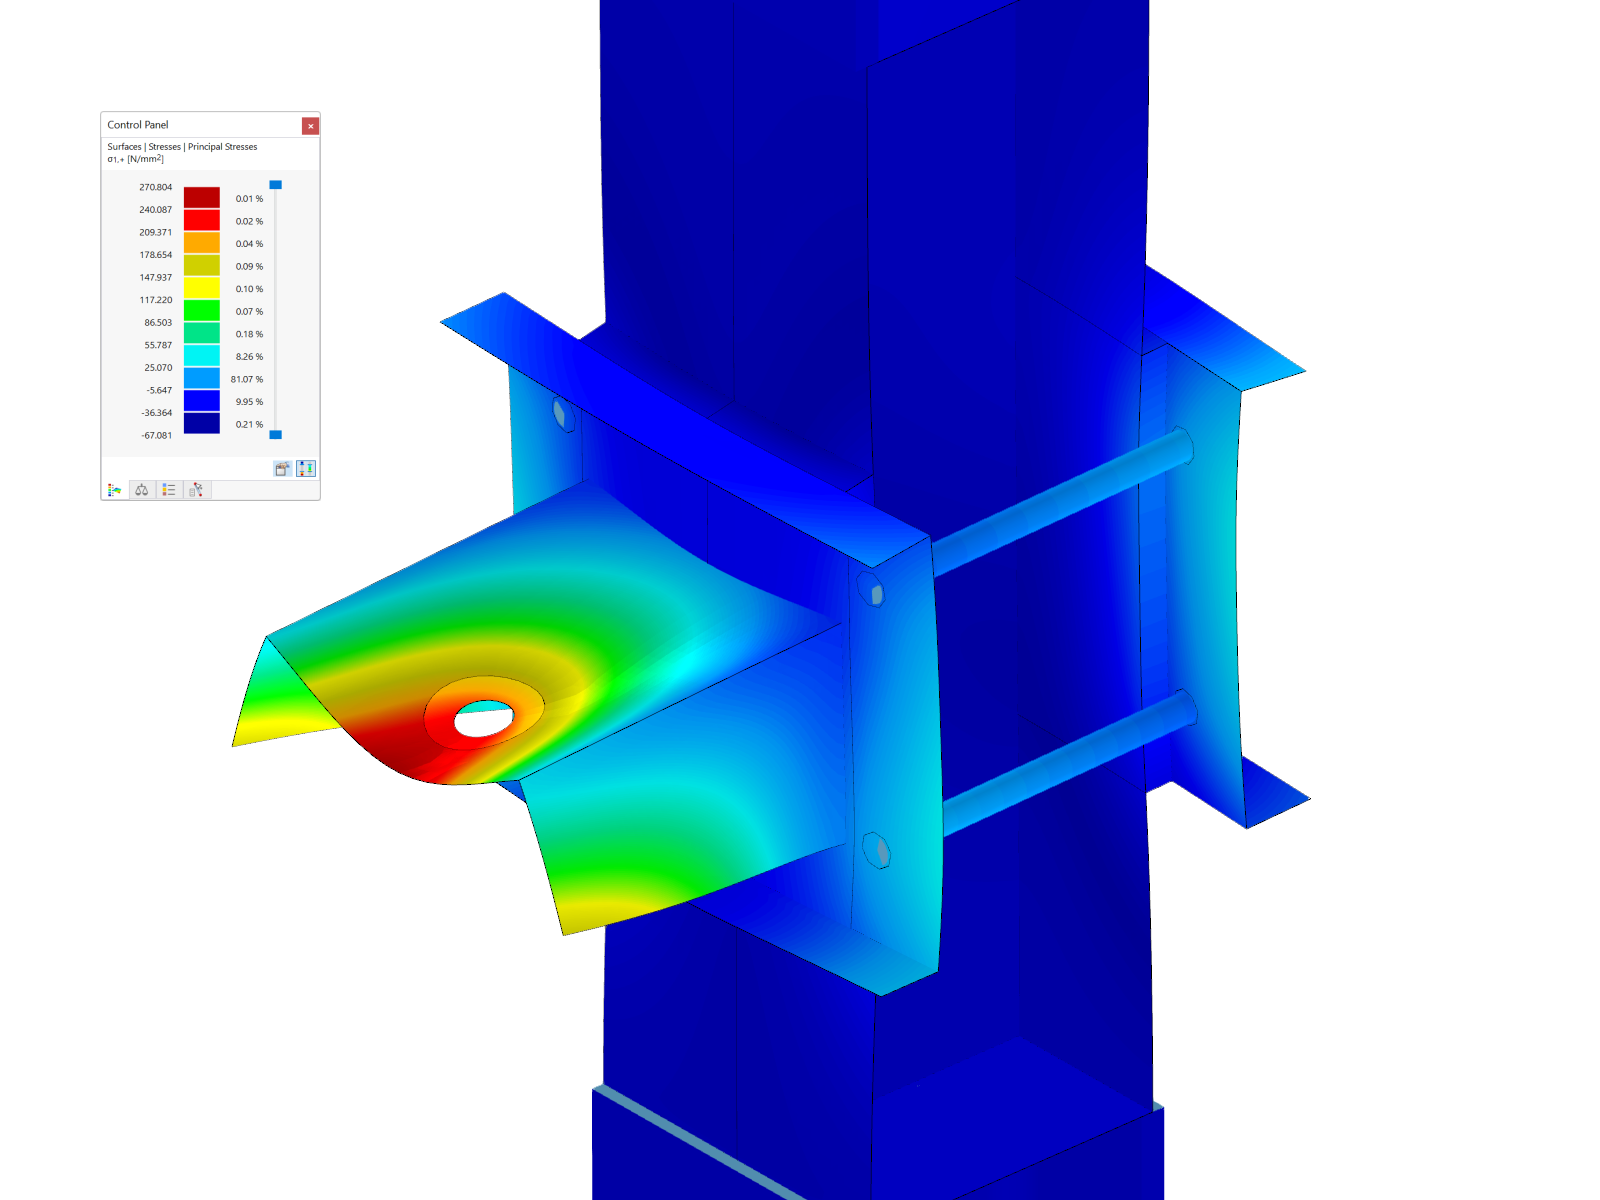
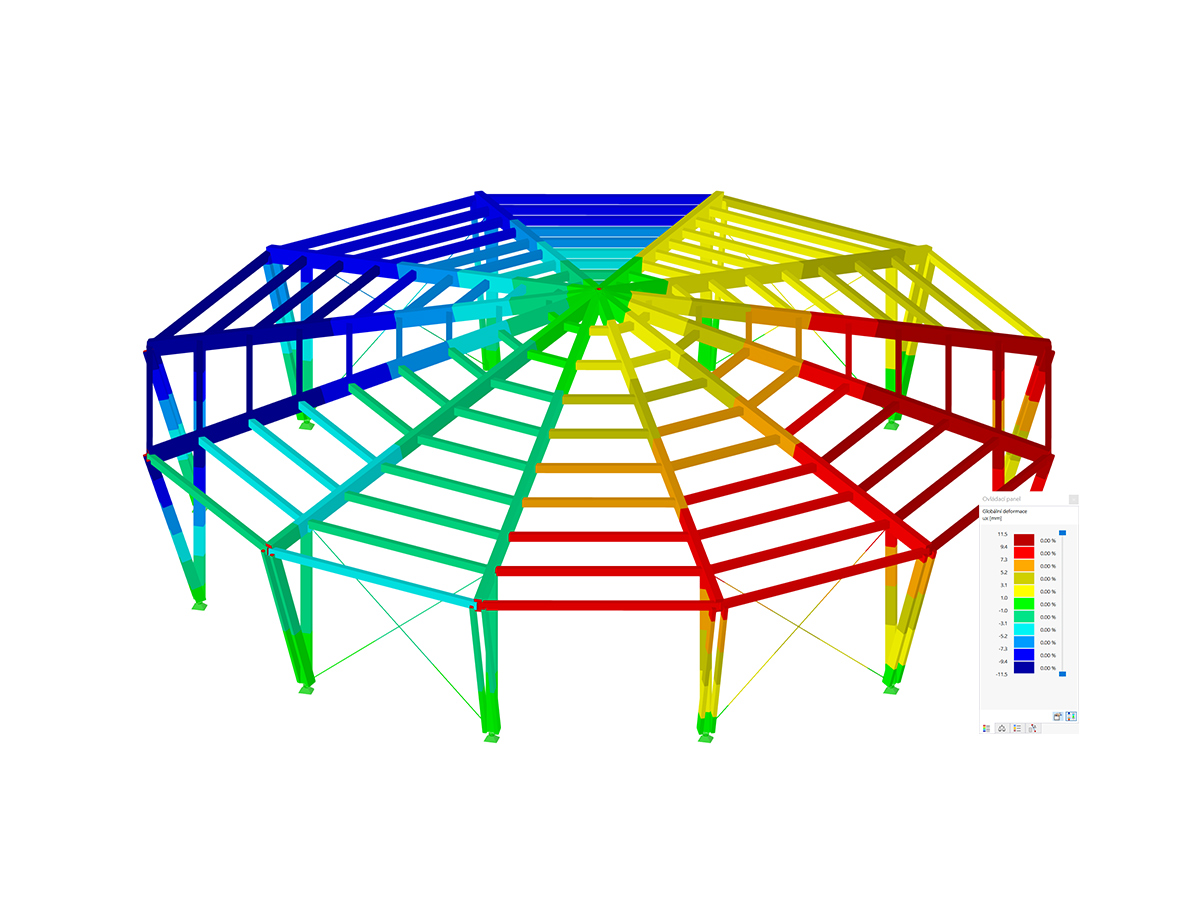
During the calculation, the selected horizontal load is increased in load steps. A static nonlinear analysis is carried out for each load step until reaching the specified limit condition.
The results of the pushover analysis are extensive. On one hand, the structure is analyzed for its deformation behavior. This can be represented by a force-deformation line of the system (a capacity curve). On the other hand, the response spectrum effect can be displayed in the ADRS display (Acceleration-Displacement Response Spectrum). The target displacement is automatically determined in the program based on these two results. The process can be evaluated graphically and in tables.
The individual acceptance criteria can then be graphically evaluated and assessed (for the next load step of the target displacement, but also for all other load steps). The results of the static analysis are also available for the individual load steps.


.png?mw=350&hash=c6c25b135ffd26af9cd48d77813d2ba5853f936c)


.png?mw=512&hash=4a84cbc5b1eacf1afb4217e8e43c5cb50ed8d827)




_1.jpg?mw=350&hash=ab2086621f4e50c8c8fb8f3c211a22bc246e0552)


.png?mw=600&hash=49b6a289915d28aa461360f7308b092631b1446e)
