
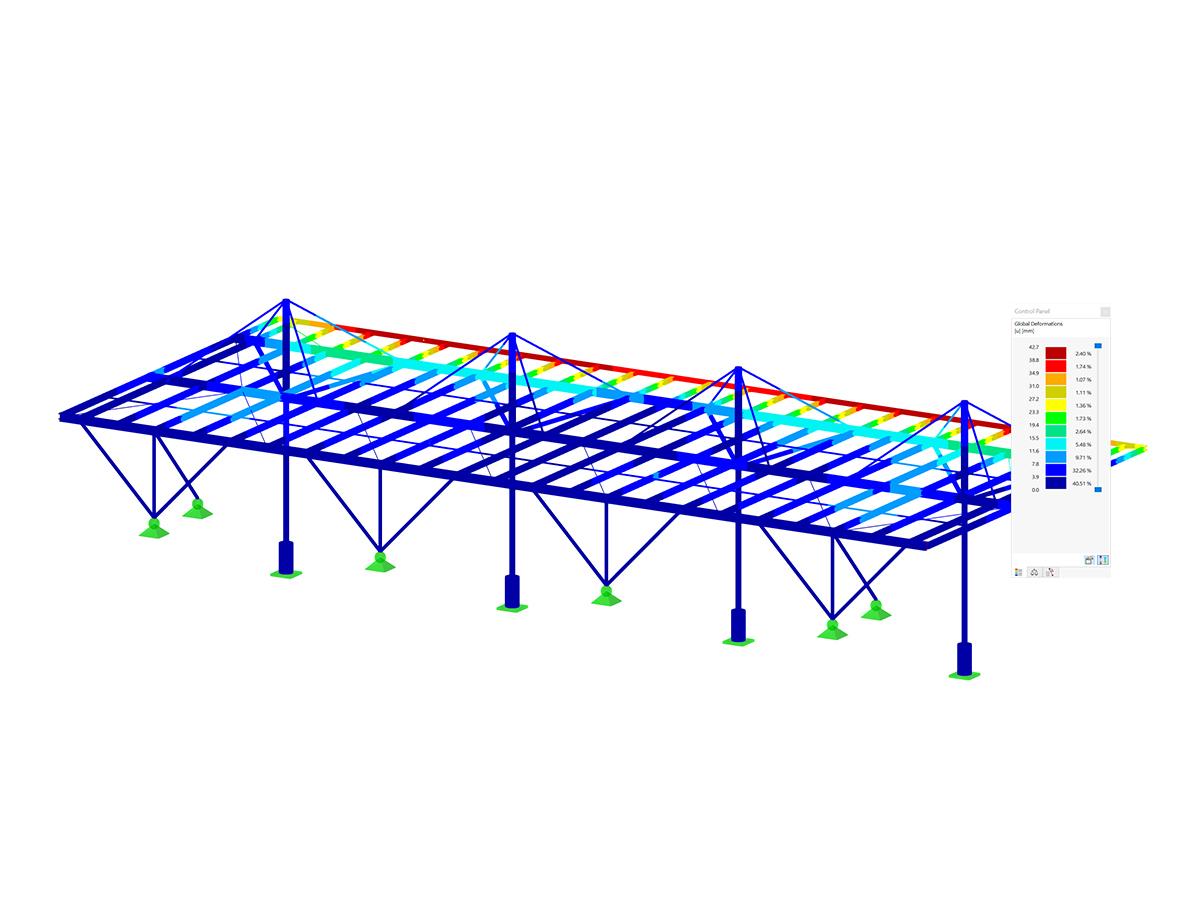
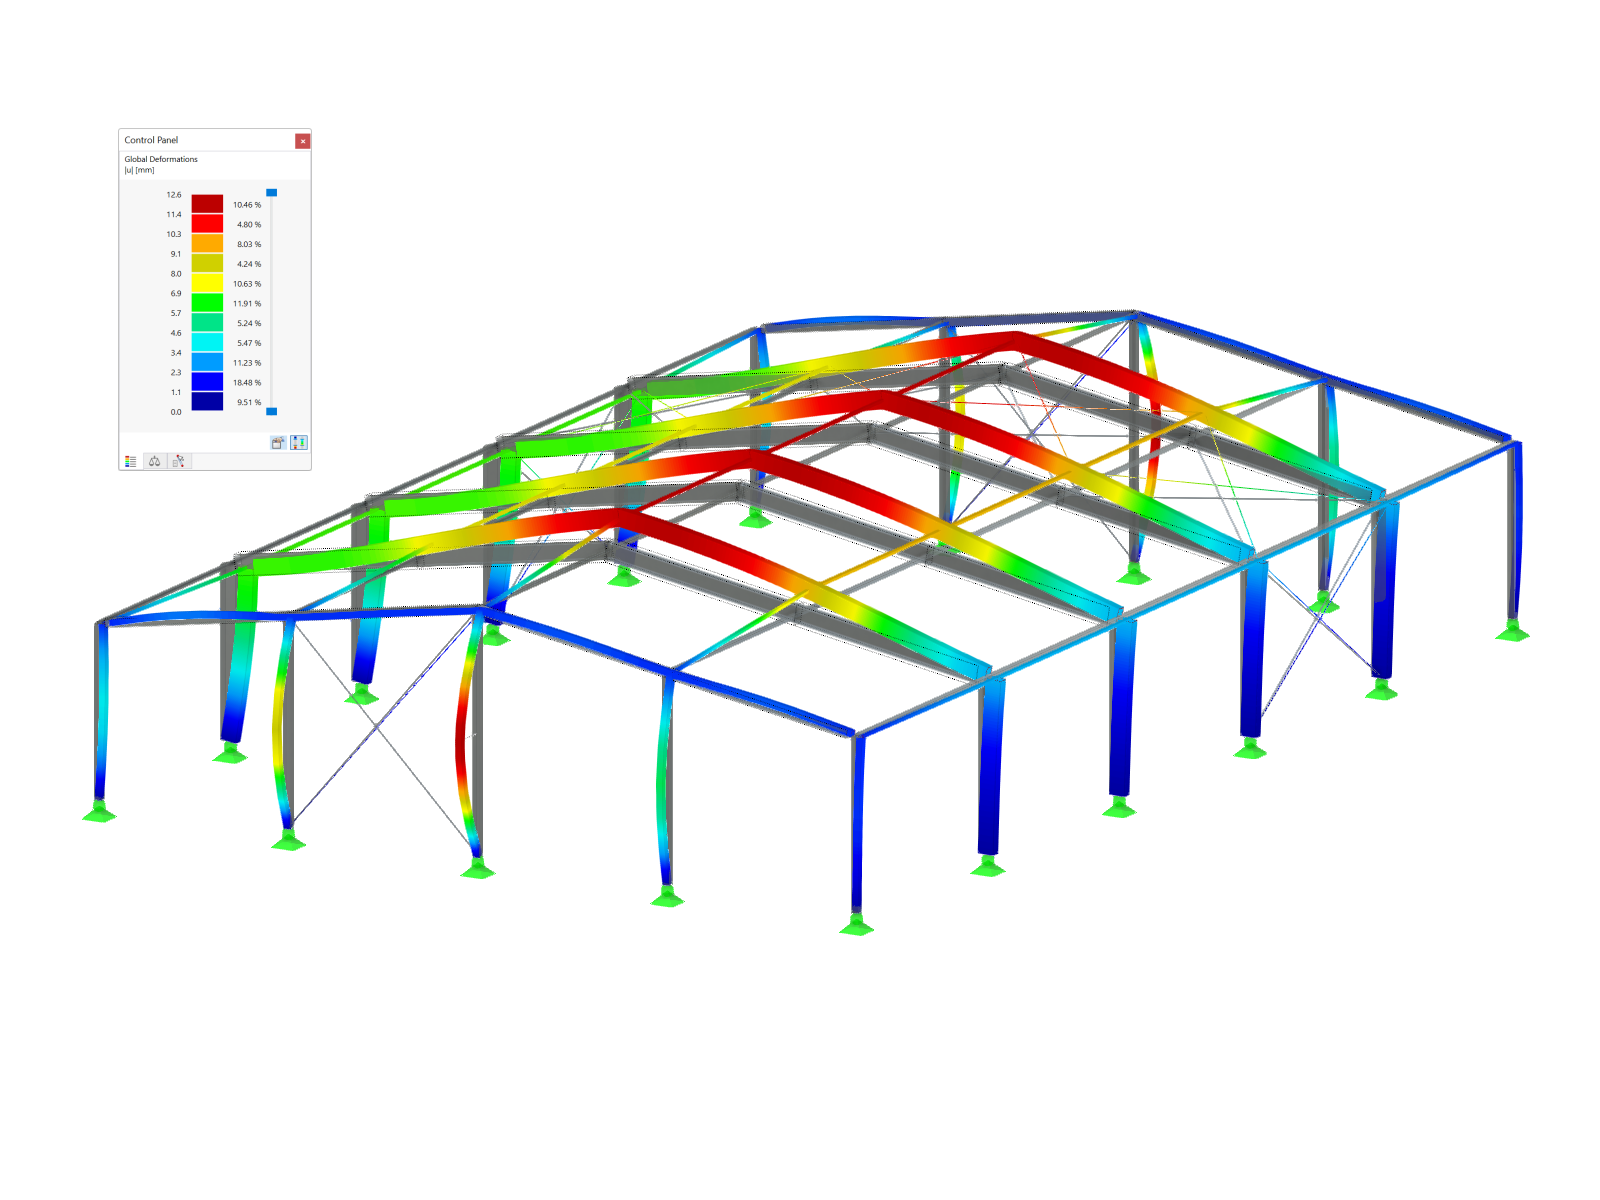
For a response spectrum analysis of building models, you can display the sensitivity coefficients for the horizontal directions by story.
These key figures allow you to interpret the sensitivity to stability effects.
For a response spectrum analysis of building models, you can display the sensitivity coefficients for the horizontal directions by story.
These key figures allow you to interpret the sensitivity to stability effects.


RFEM and RSTAB models can be saved as 3D glTF models (*.glb and *.glTF formats). View the models in 3D in detail with a 3D viewer from Google or Babylon. Take your VR glasses, such as Oculus, to "walk" through the structure.
You can integrate the 3D glTF models into your own websites using JavaScript according to the instructions (as on the Dlubal website Models to Download): "Easily display interactive 3D models on the web & in AR" .
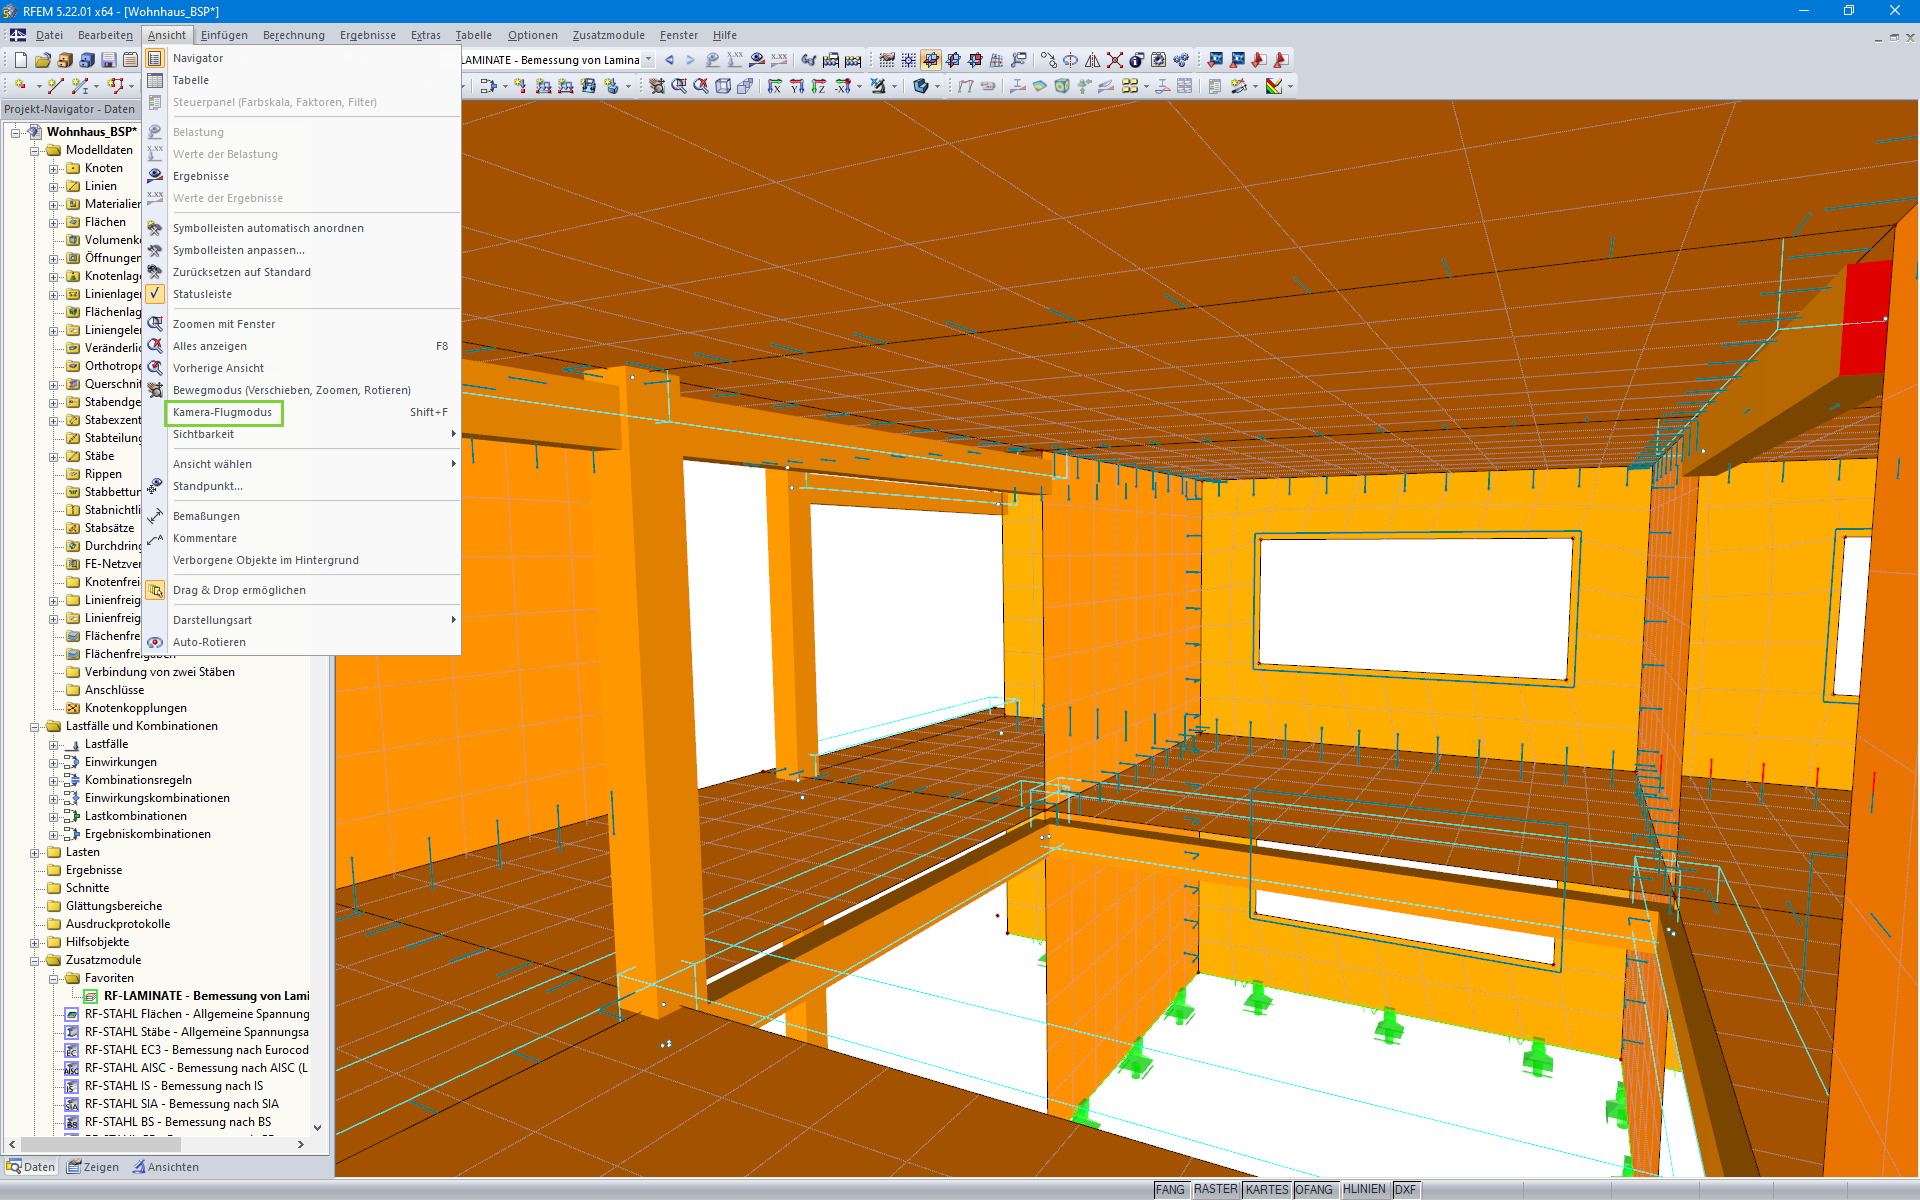
With the Camera Fly Mode view option, you can fly through your RFEM and RSTAB structure. Control the direction and speed of the flight with your keyboard. Additionally, you can save the flight through your structure as a video.
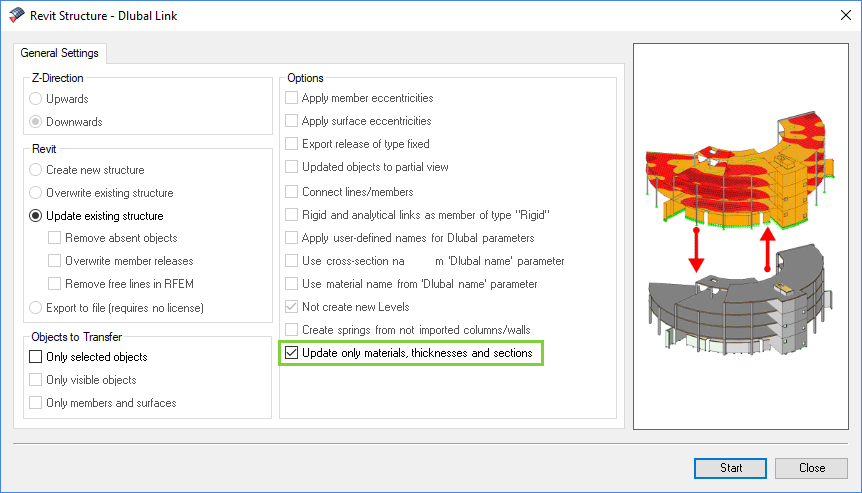
The direct interface with Revit allows you to update the Revit model according to the changes you have made in RFEM or RSTAB. Depending on the modification, the Revit objects may have to be regenerated (deleting the object and subsequent regeneration). The regeneration is performed on the basis of the RFEM/RSTAB model.
If you want to avoid this regeneration, activate the check box 'Update only materials, thicknesses, and sections'. In this case, only the properties of the objects will be adjusted. Changes different from those in material, surface thickness, and section are, however, not considered in this case.
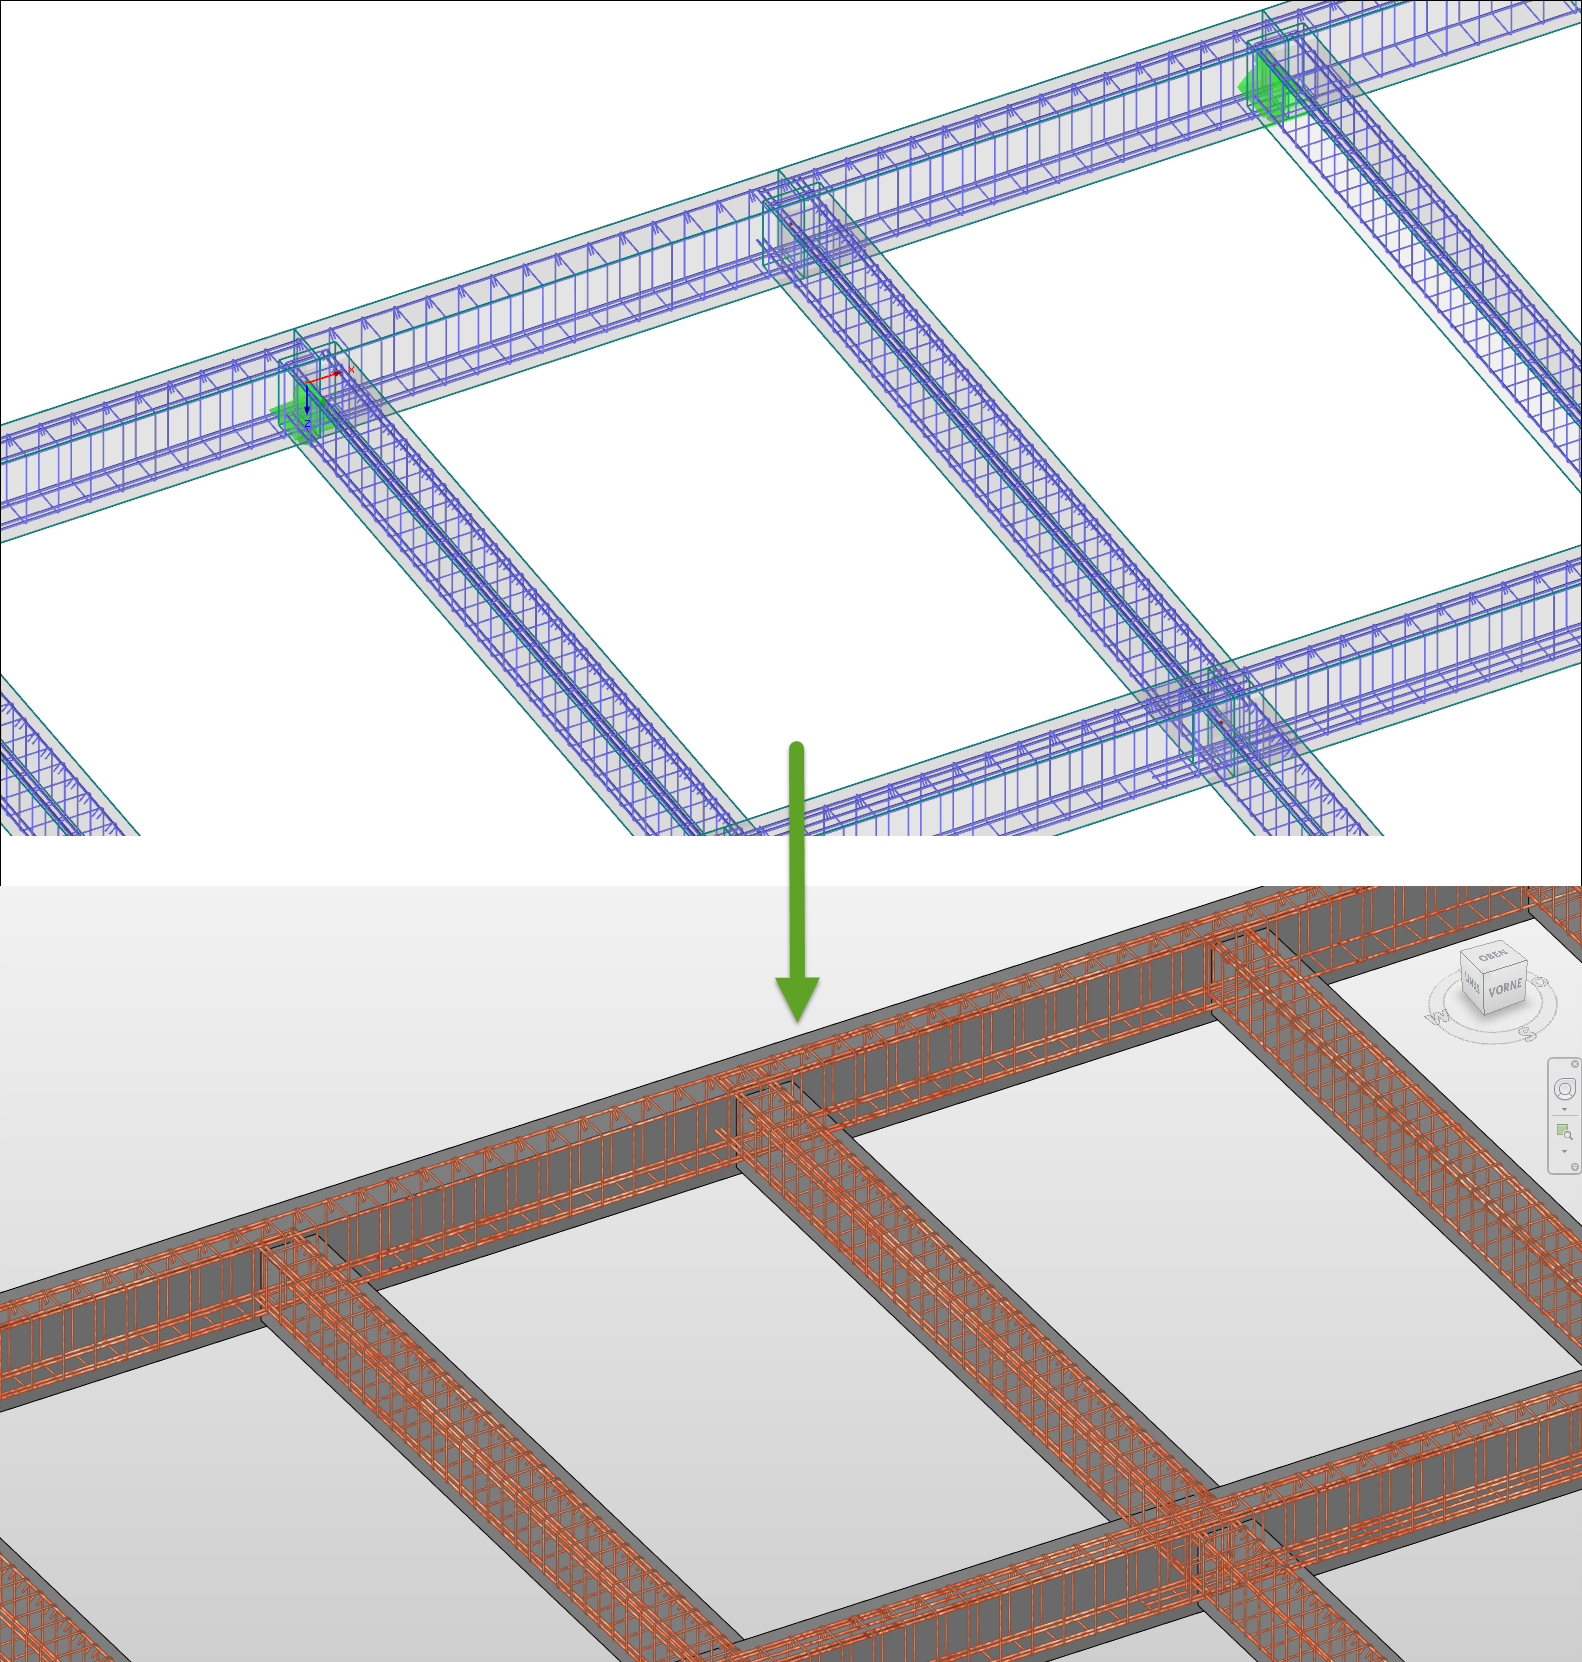
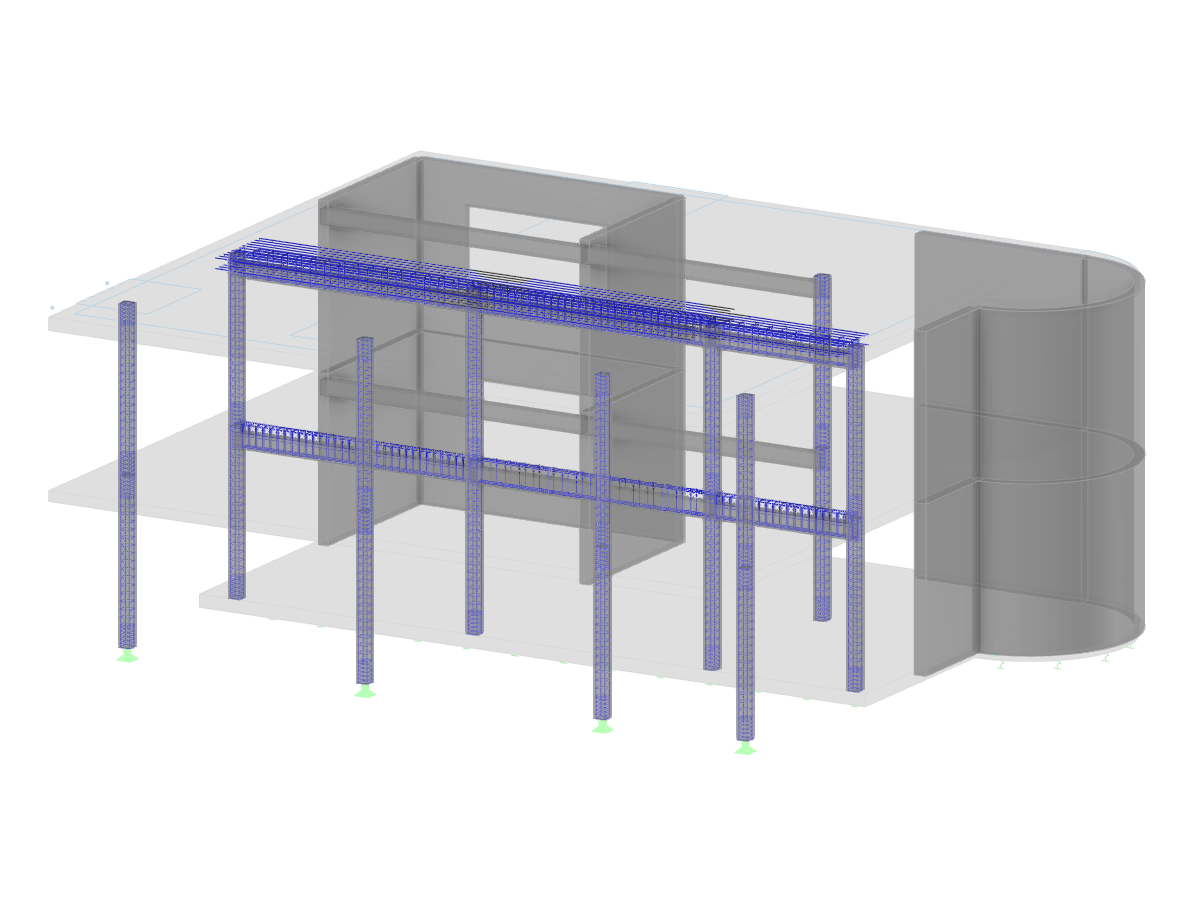
The reinforcement proposal from RF-/CONCRETE Members can be exported to Revit. The rectangular and circular cross-sections are currently supported.
The reinforcement bars can be modified retroactively in Revit.
Where can I find the update reports for RFEM 5, RSTAB 8, SHAPE-THIN, SHAPE-MASSIVE, RX-TIMBER, CRANEWAY, PLATE-BUCKLING, COMPOSITE-BEAM?
For my NVIDIA graphics card, I need to select between a driver from the "Production Branch" and a "New Feature Branch." Which driver is best suited for RFEM/RSTAB?
The new generation of 3D FEA software is used for the structural analysis of members, surfaces, and solids.
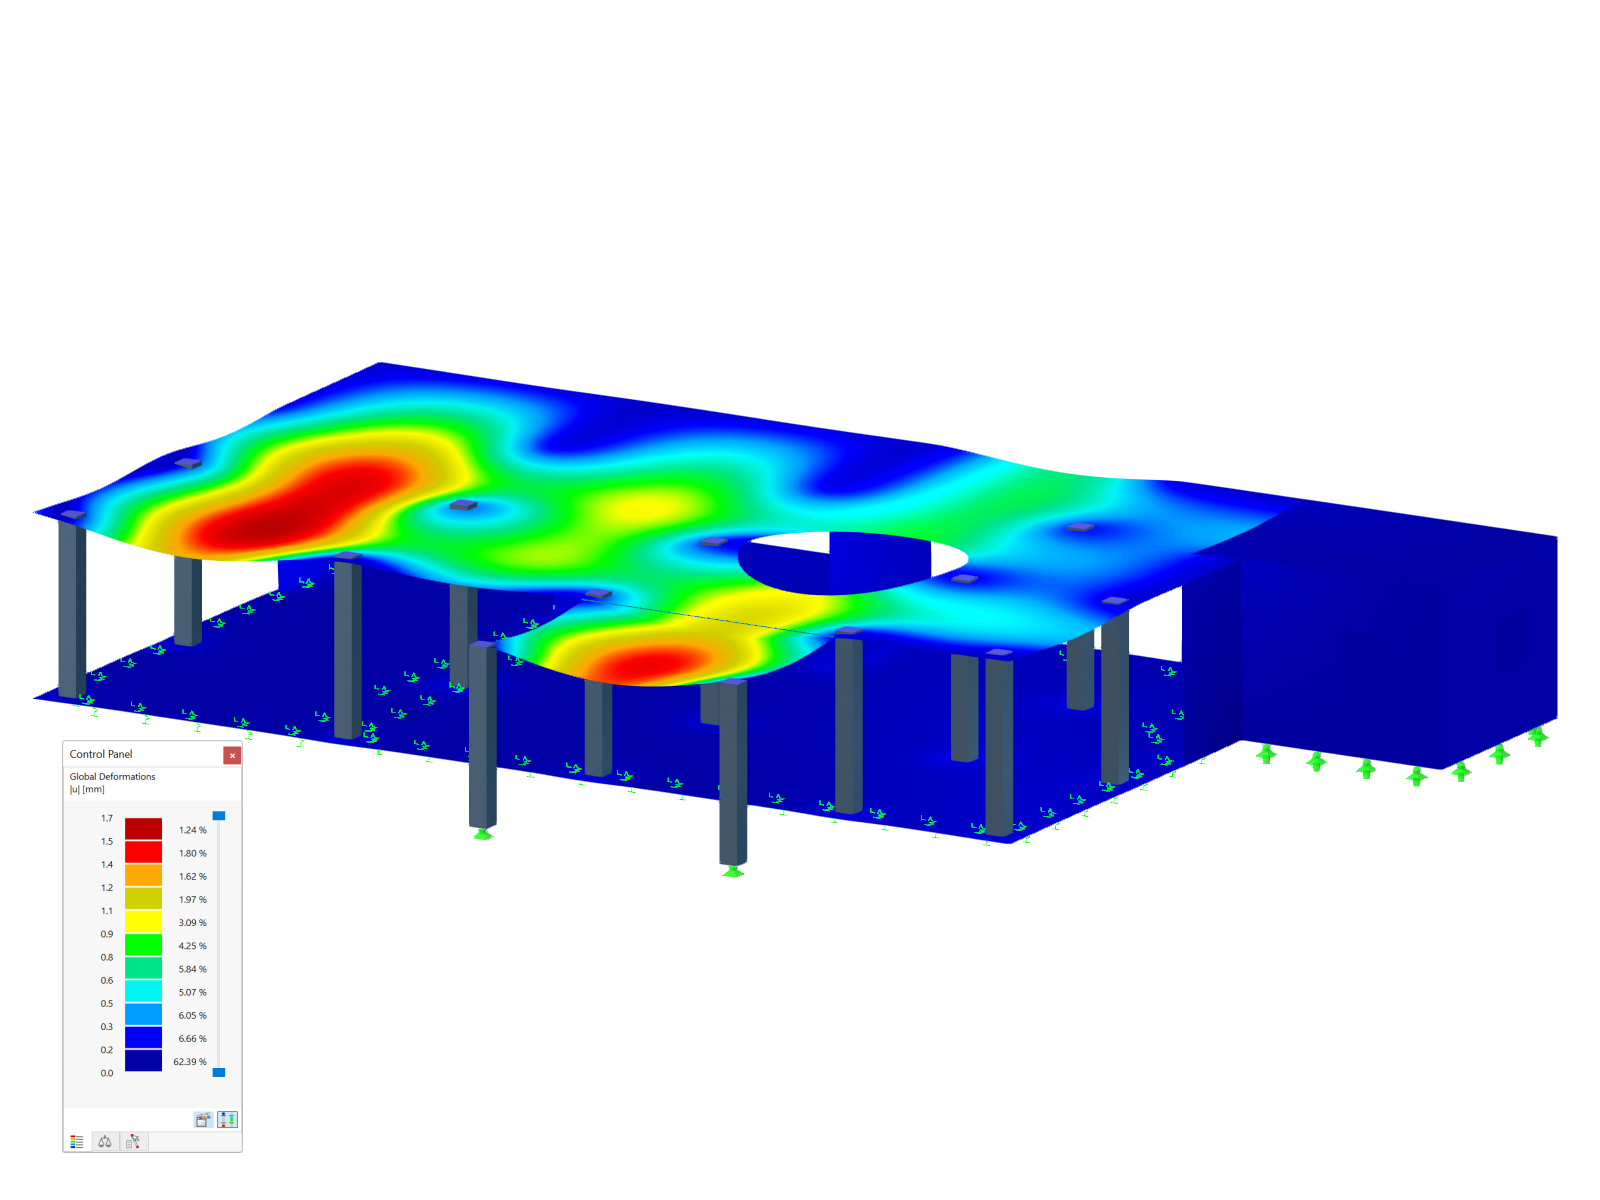
The Concrete Design add-on allows for various design checks according to international standards. You can design members, surfaces, and columns, as well as perform punching and deformation analyses.
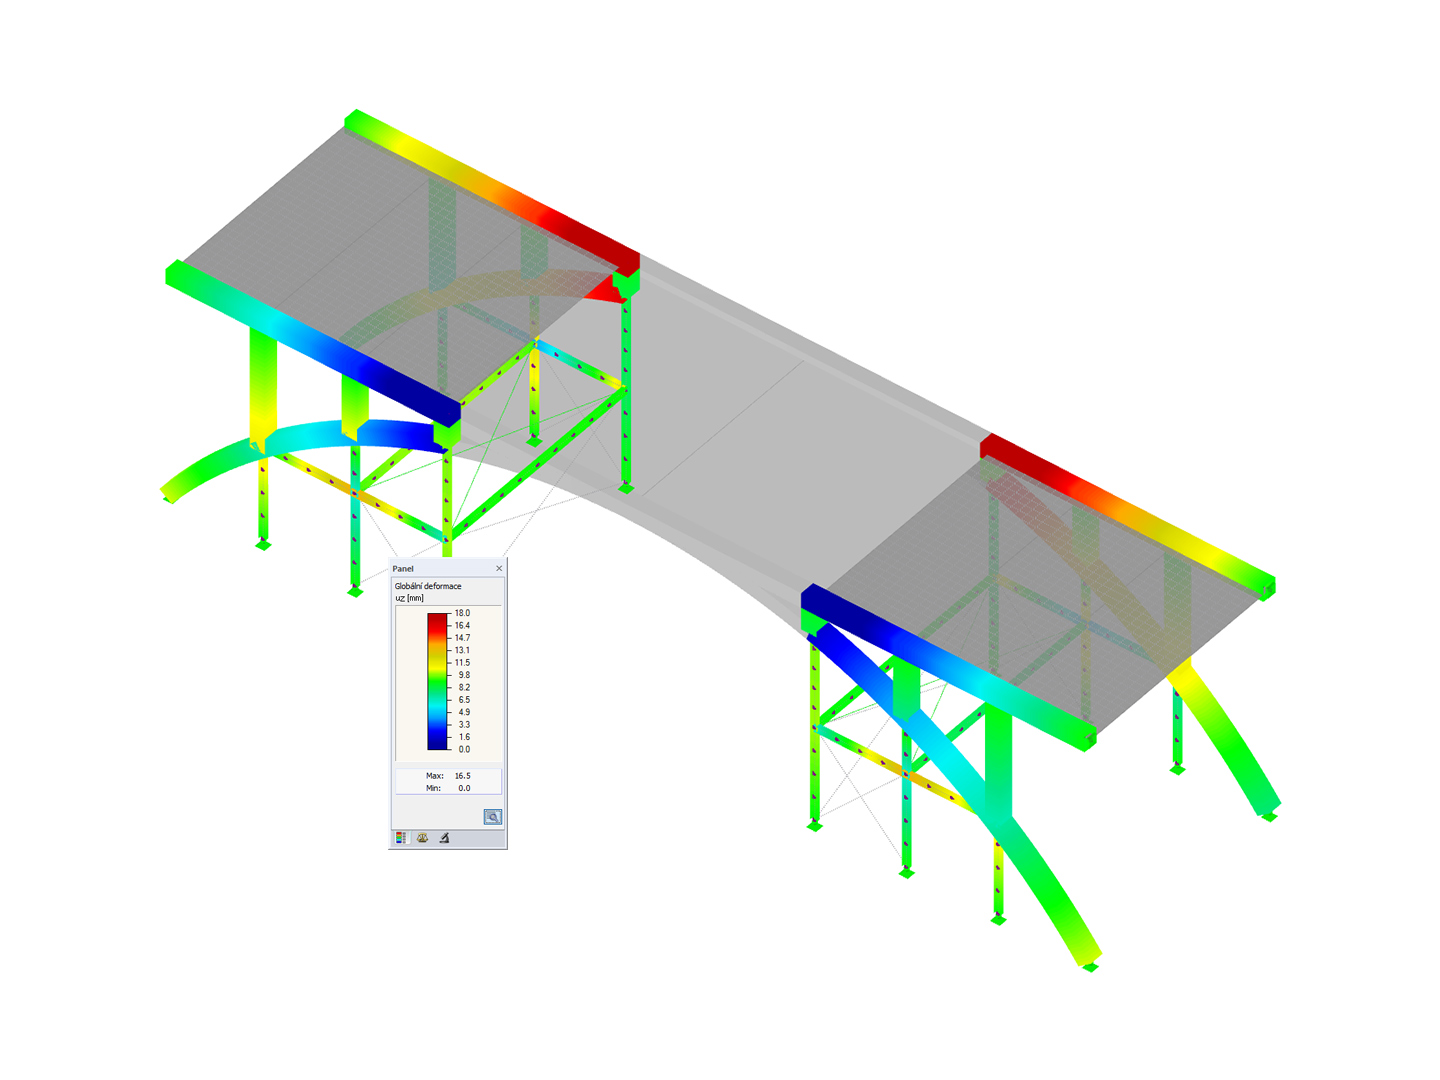
The Construction Stages Analysis (CSA) add-on allows for considering the construction process of structures (member, surface, and solid structures) in RFEM.
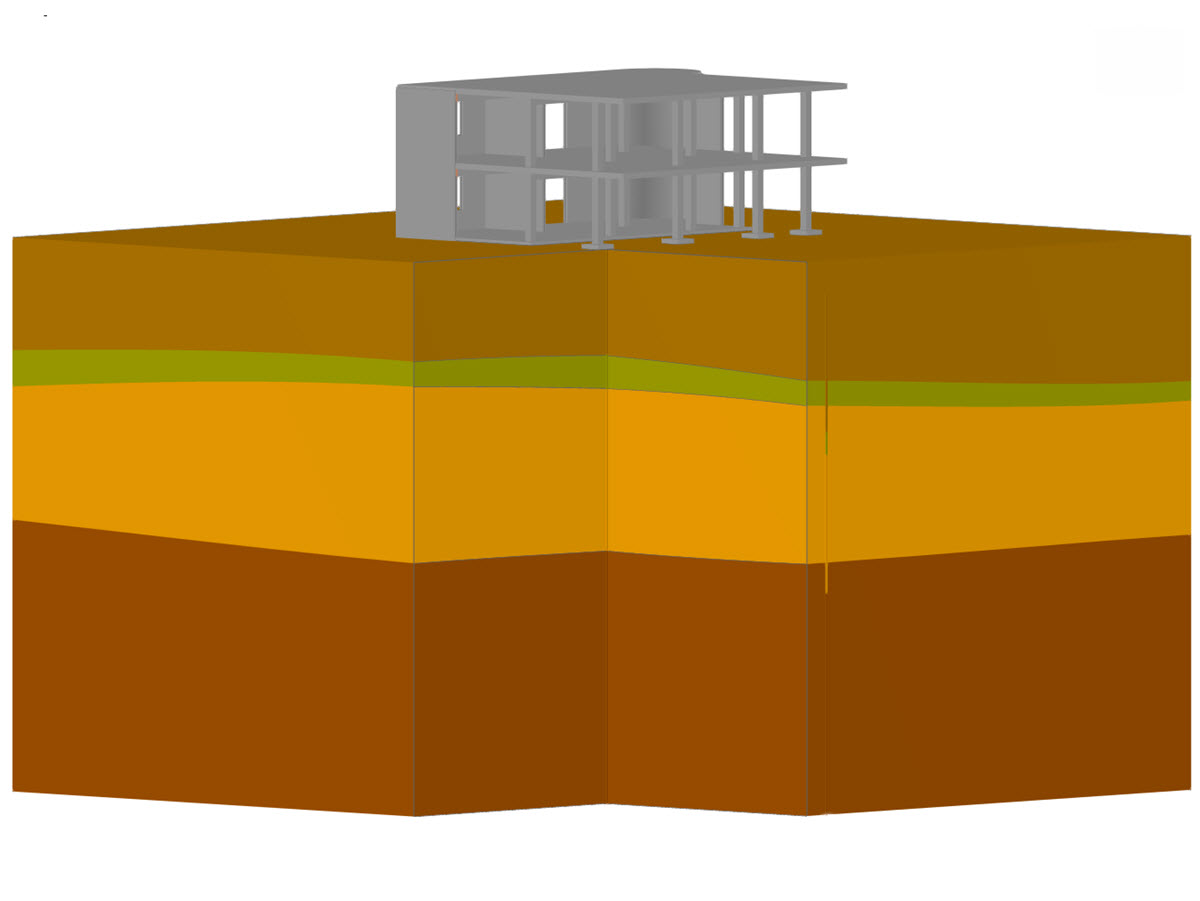
In RFEM, the Geotechnical Analysis add-on uses properties from soil samples to determine the soil body to be analyzed. The accurate determination of soil conditions significantly affects the quality of the structural analysis of buildings.
The Modal Analysis add-on allows for the calculation of eigenvalues, natural frequencies, and natural periods for member, surface, and solid models.
The Response Spectrum Analysis add-on performs seismic analysis using multi-modal response spectrum analysis. The spectra required for this can be created in compliance with the standards or can be user-defined. The equivalent static forces are generated from them. The add-on includes an extensive library of accelerograms from seismic zones that can be used to generate the response spectra.
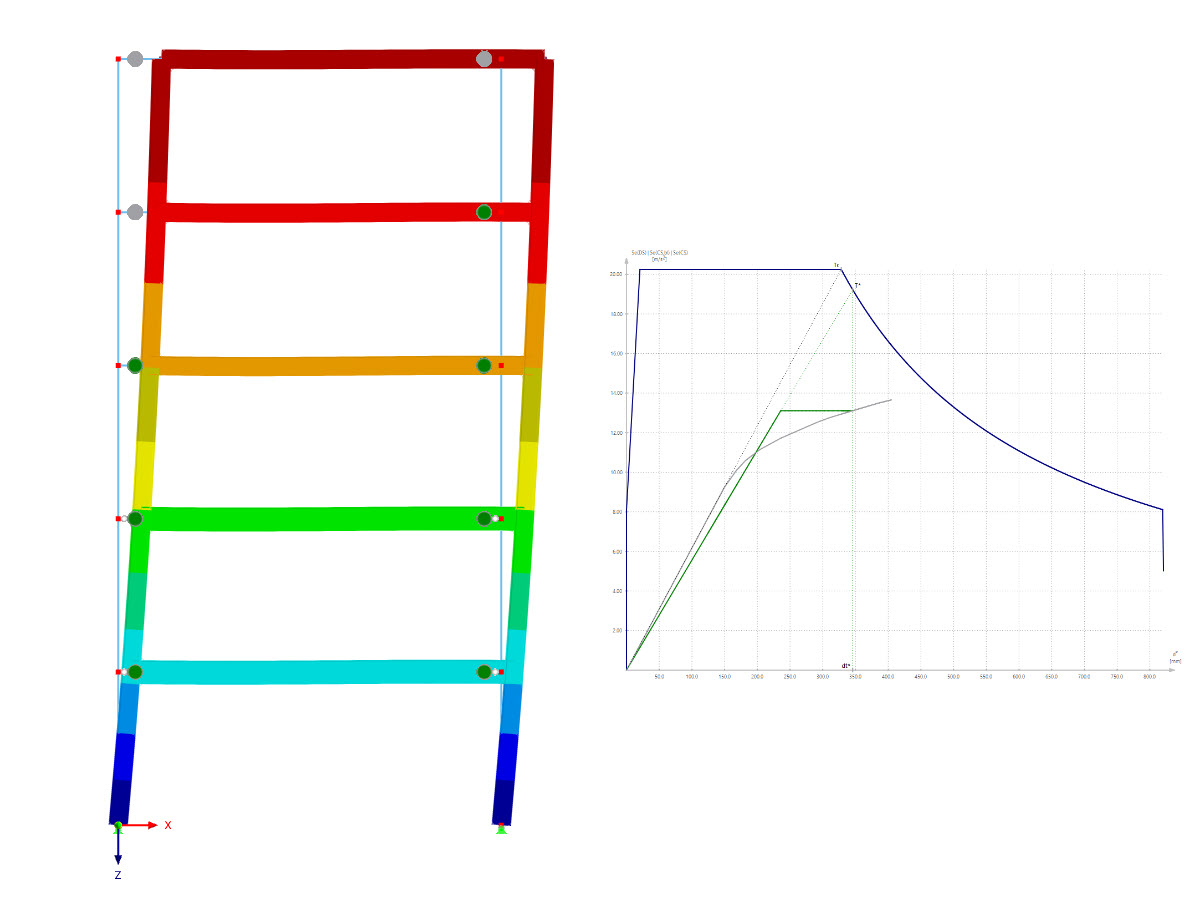
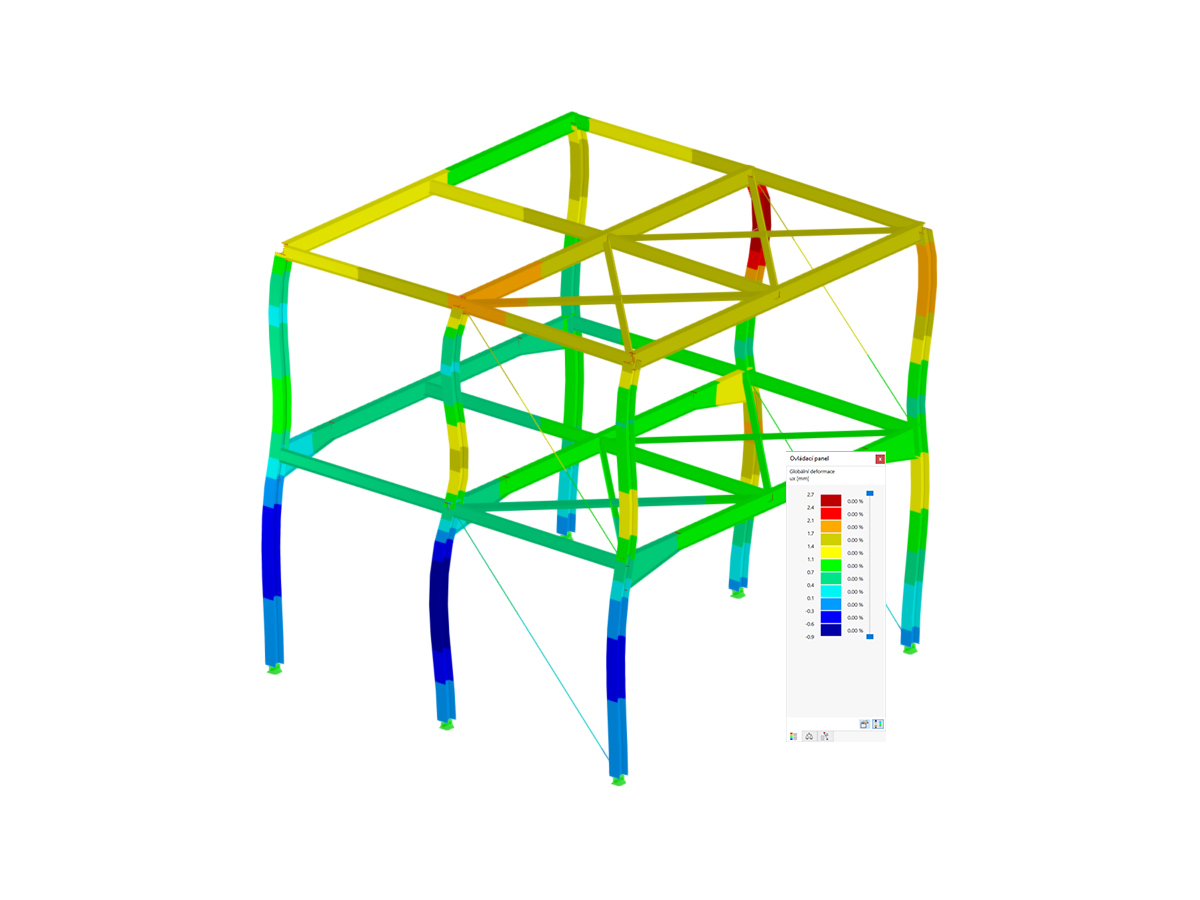
Using the Pushover Analysis add-on, you can analyze the seismic actions on a particular building, and thus assess whether the building can withstand an earthquake.

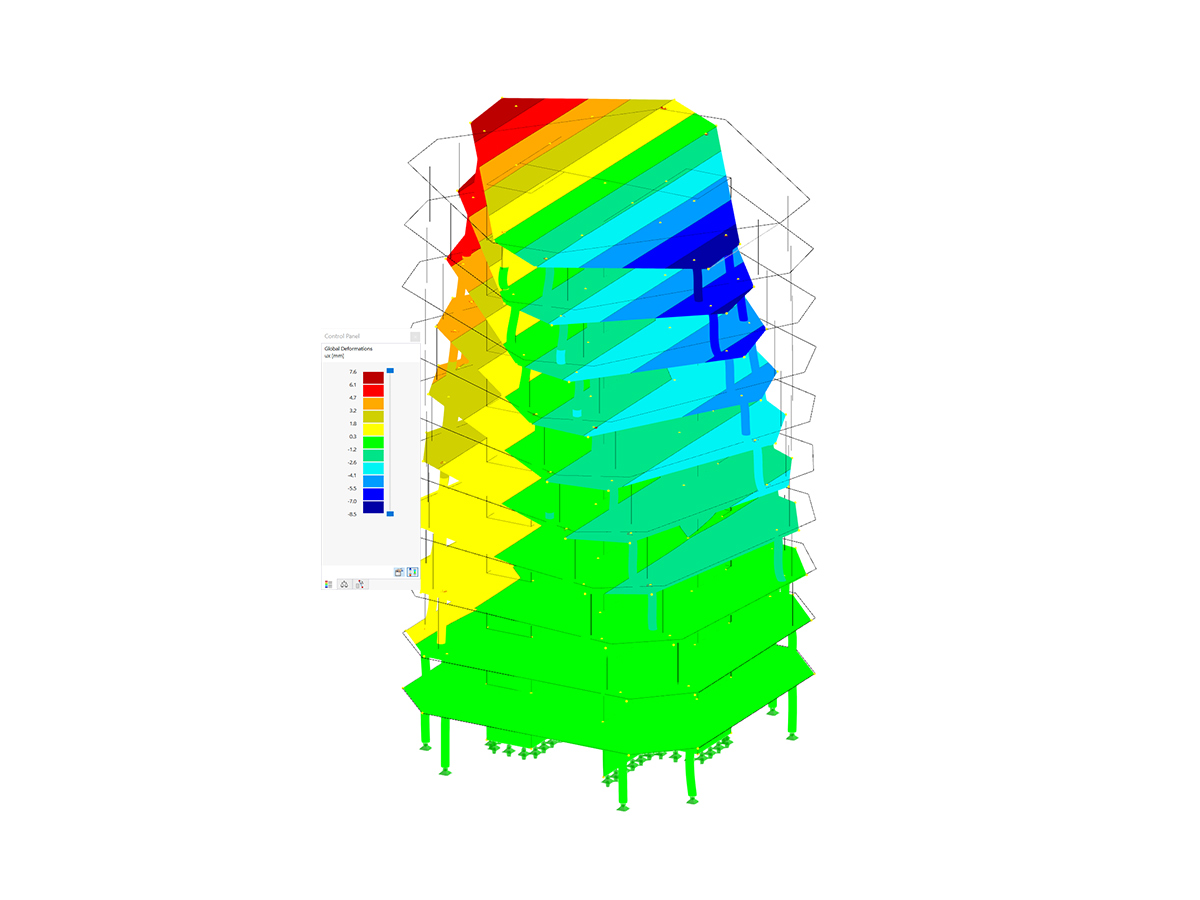
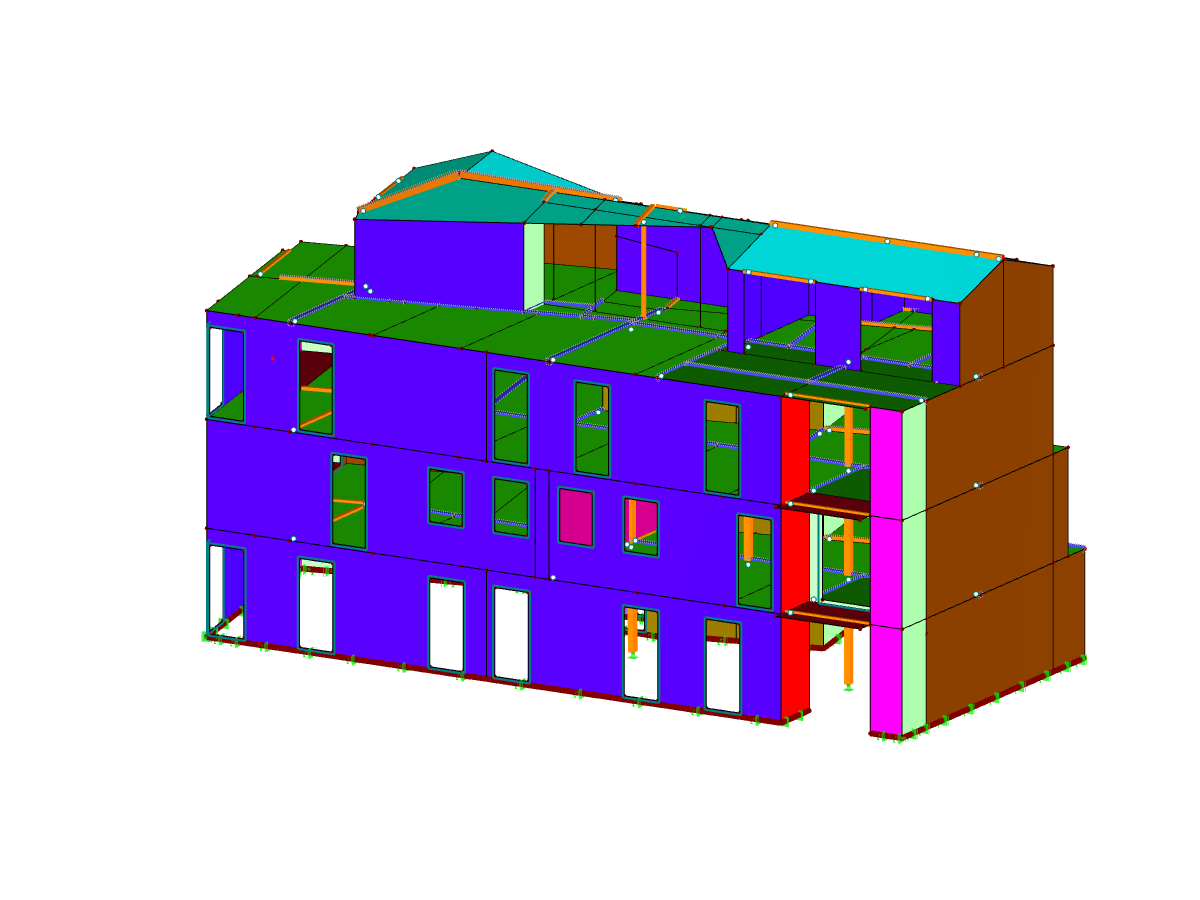
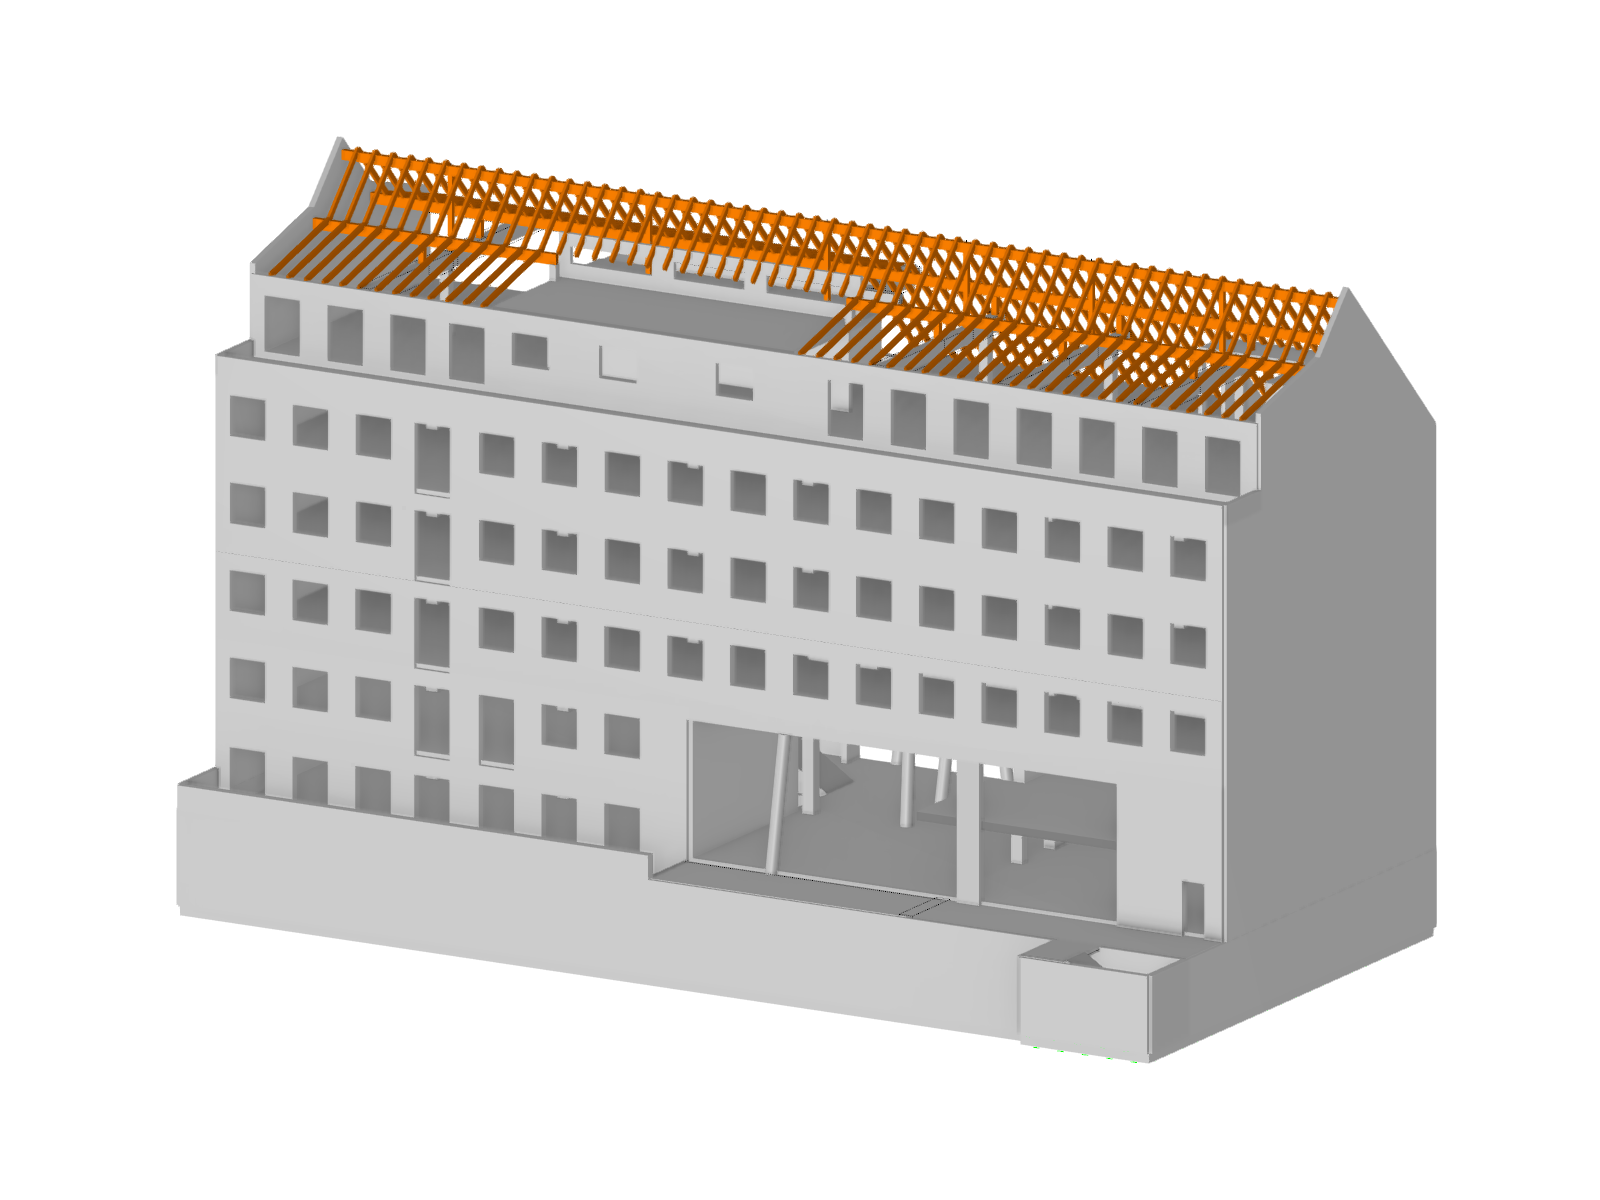
The Building Model add-on for RFEM allows you to define and manipulate a building using stories. The stories can be adjusted in many ways afterwards. The information about stories and the entire model (center of gravity) is displayed in tables and graphics.
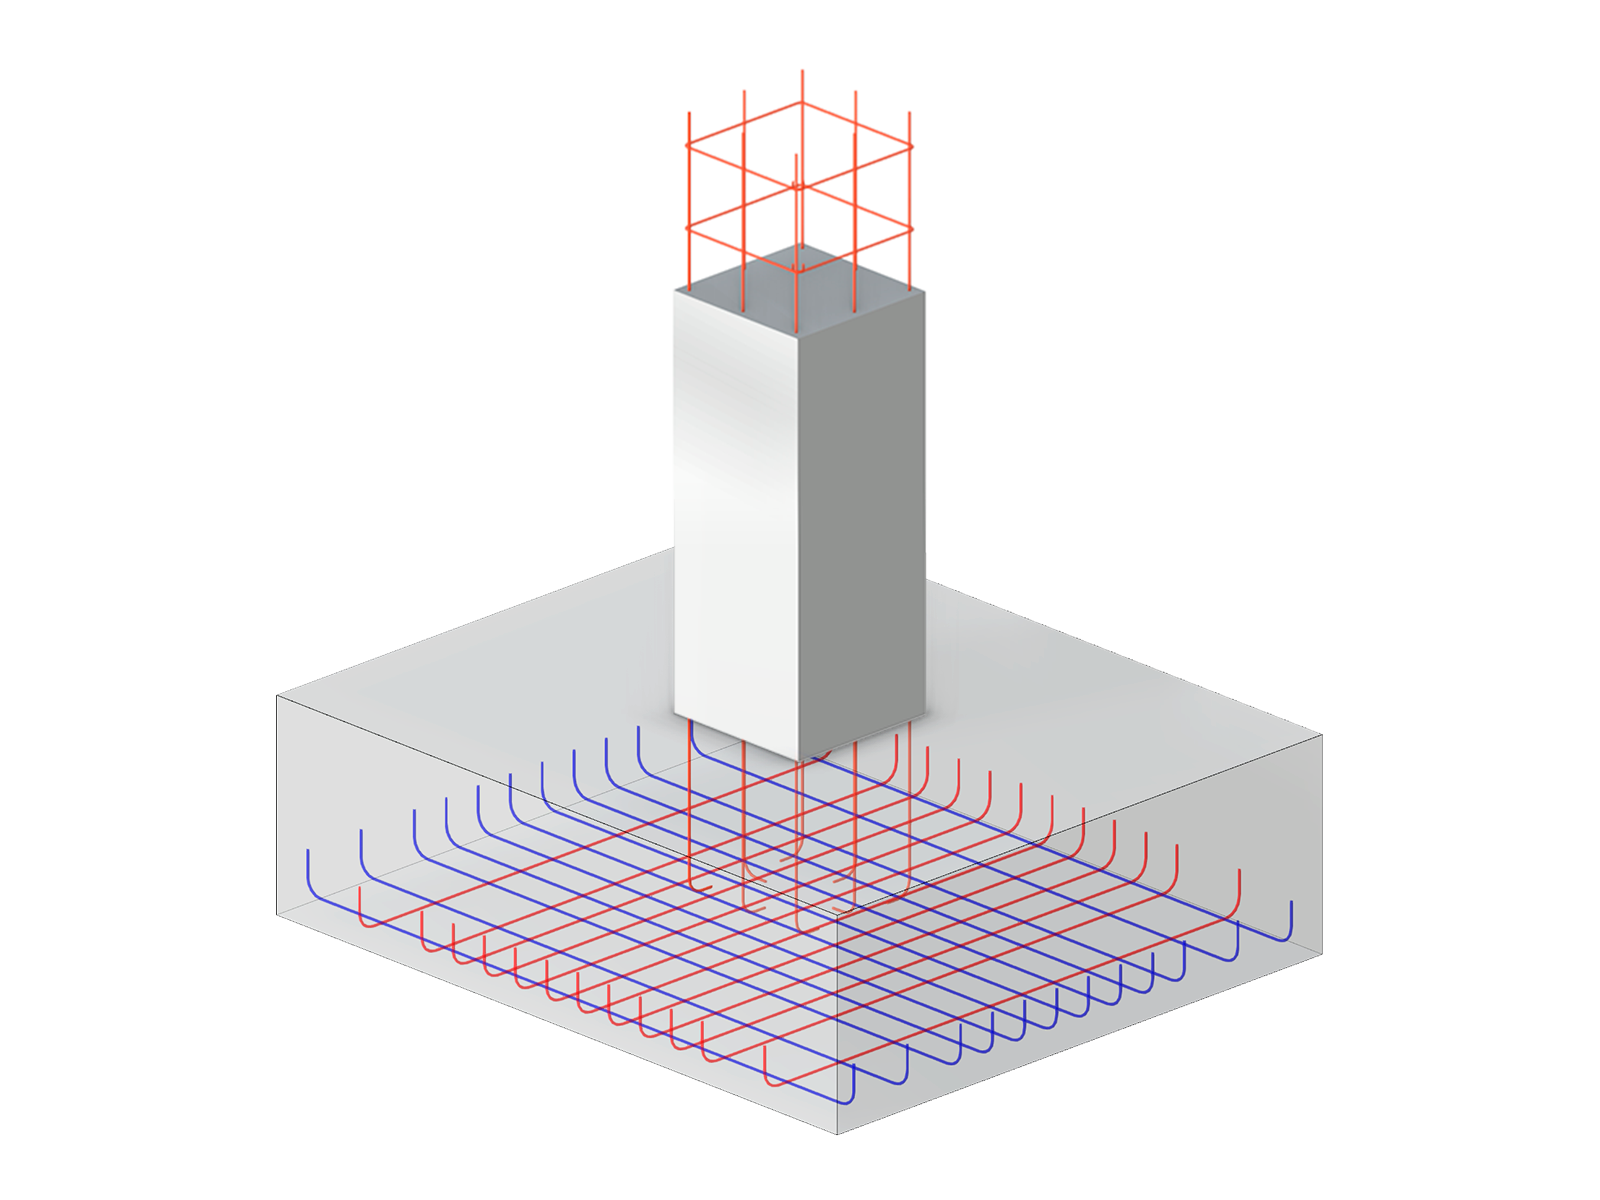
With the Concrete Foundations add-on, you can design square and rectangular individual foundations. In addition to the reinforced concrete design, geotechnical verifications are also carried out. You also determine automatic reinforcement suggestions and receive detailed reinforcement plans and 3D renderings of the foundation structures.
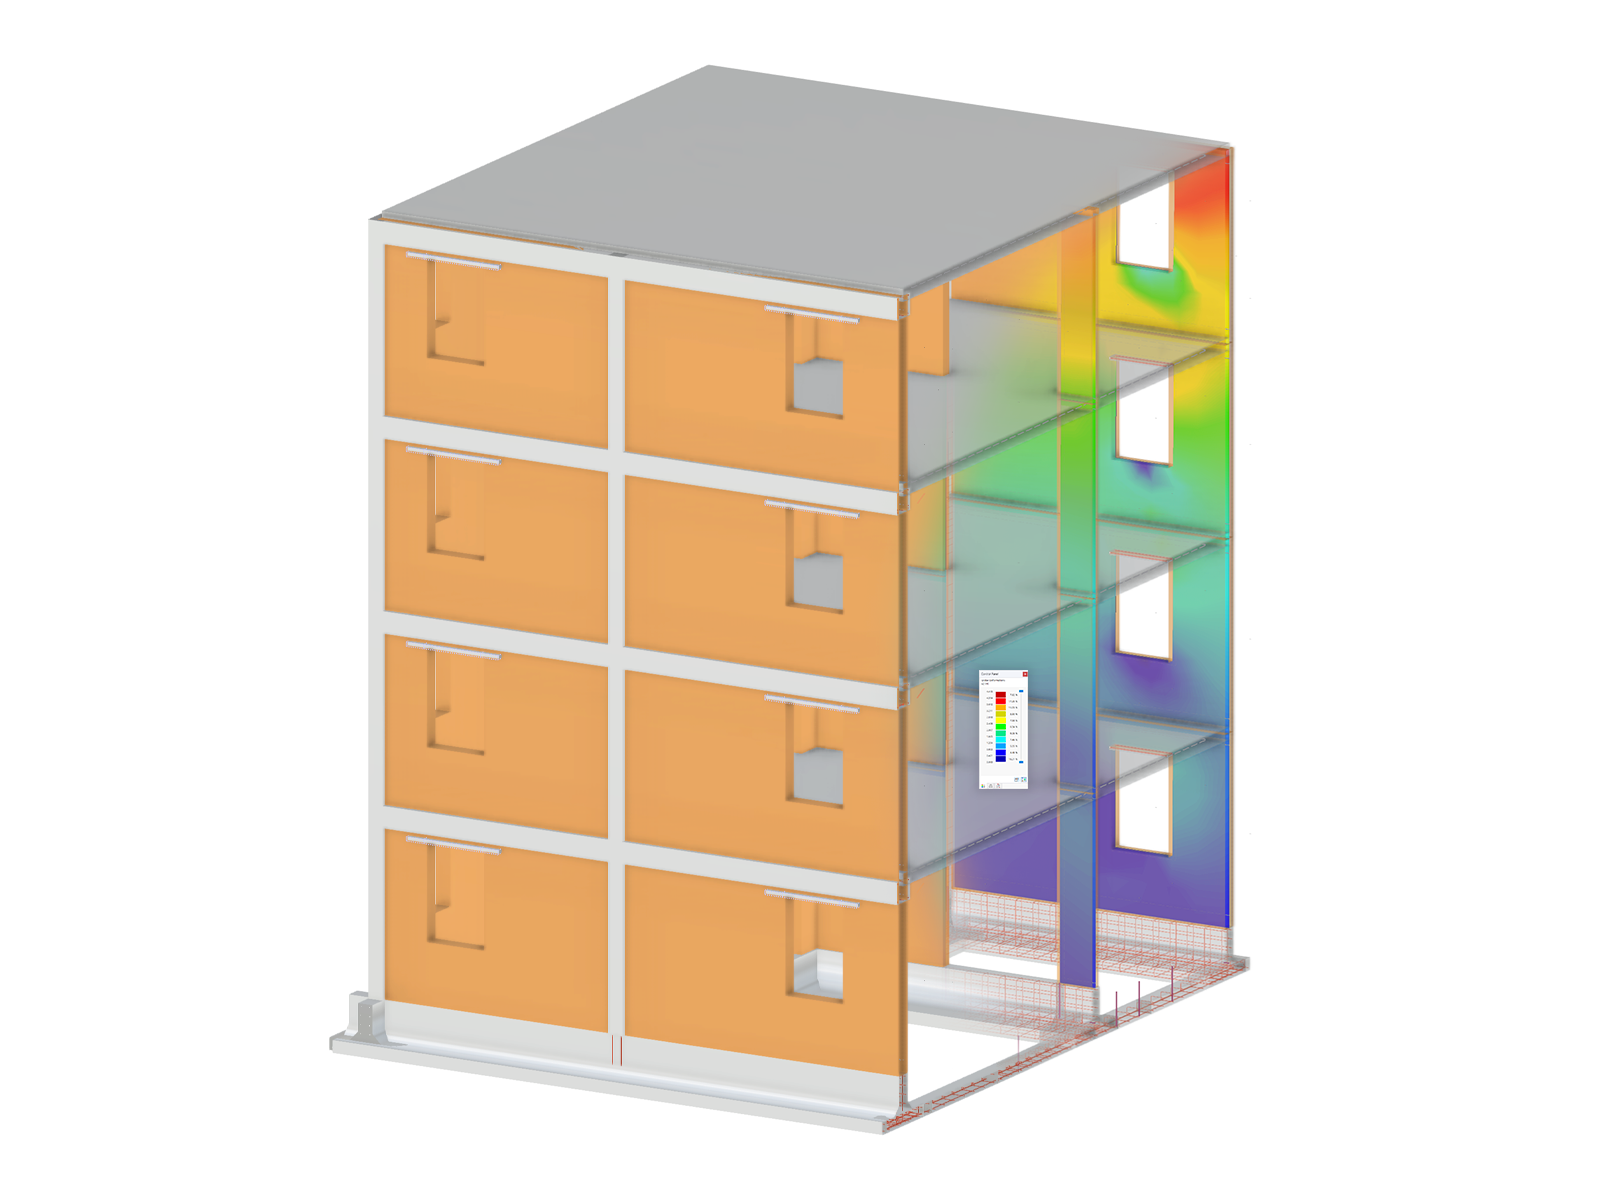
The Masonry Design add-on for RFEM allows you to design masonry using the finite element method. It was developed as part of the research project titled DDMaS – Digitizing the Design of Masonry Structures. The material model represents the nonlinear behavior of the brick-mortar combination in the form of macro-modeling.
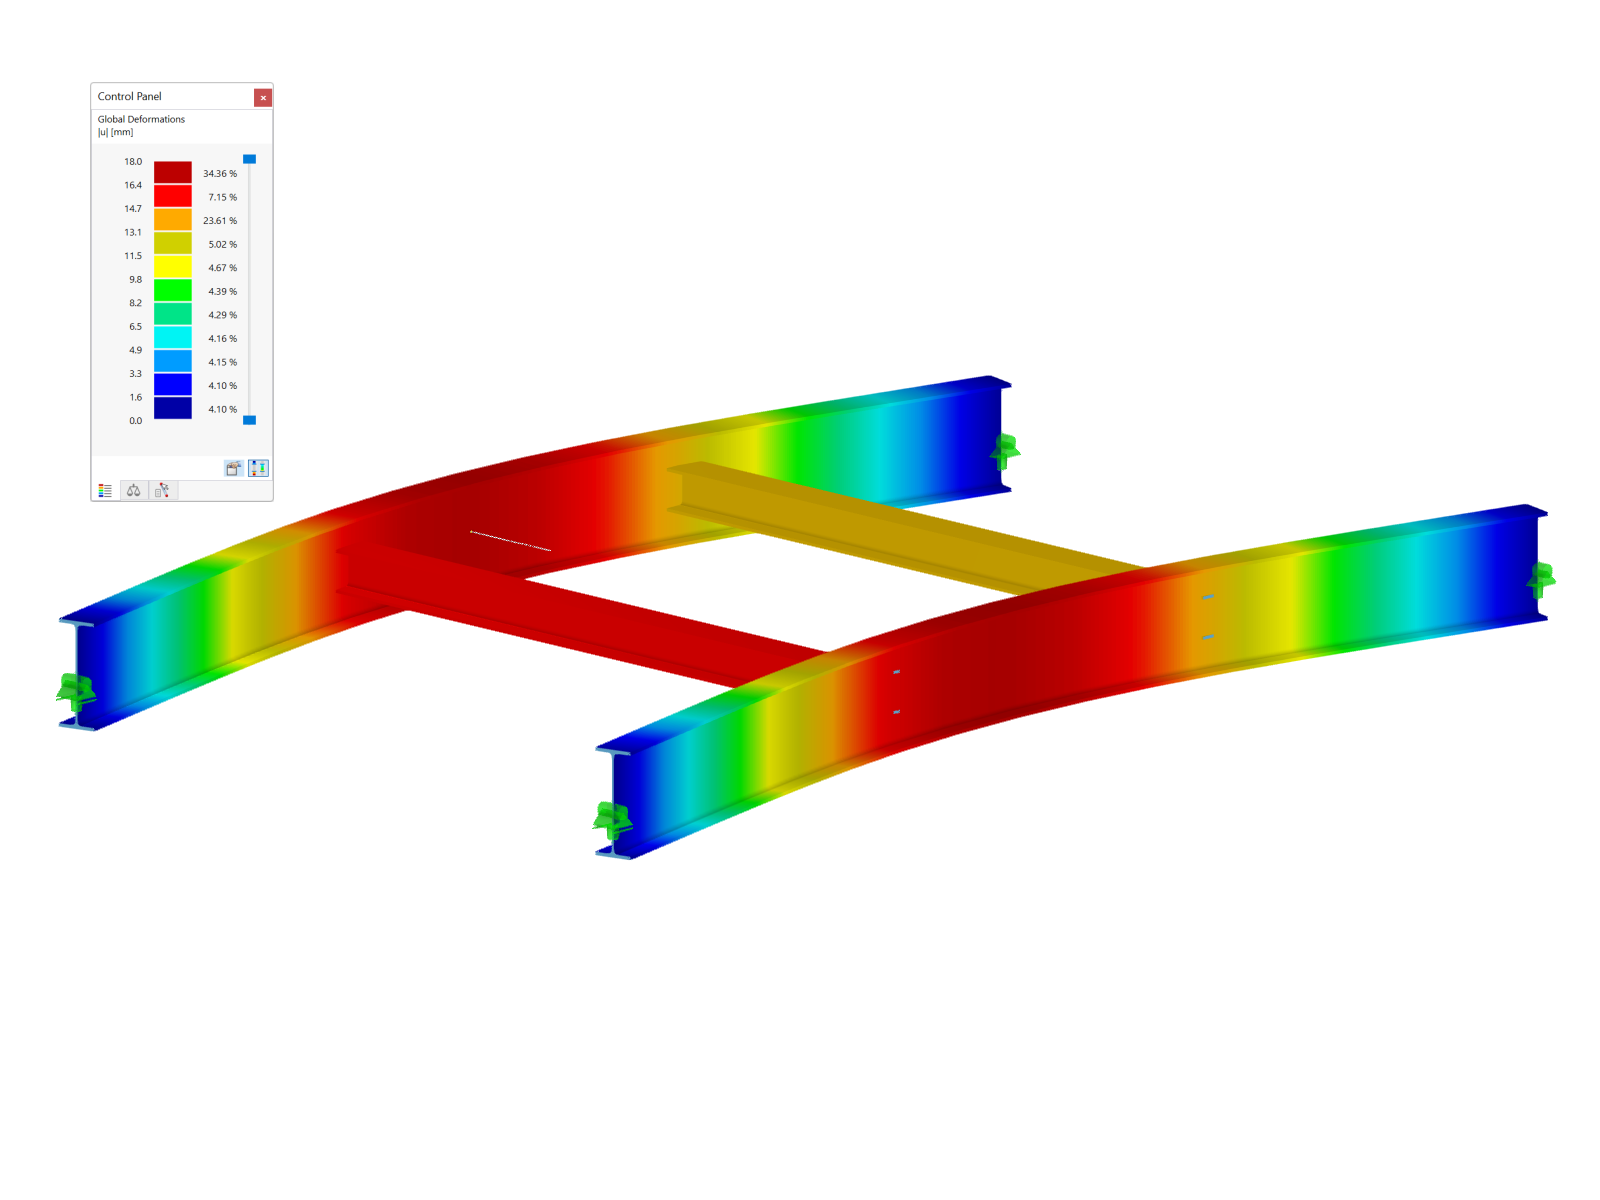
The Steel Design add-on performs the ultimate and serviceability limit state design checks of steel members according to various standards.
.png?mw=600&hash=49b6a289915d28aa461360f7308b092631b1446e)
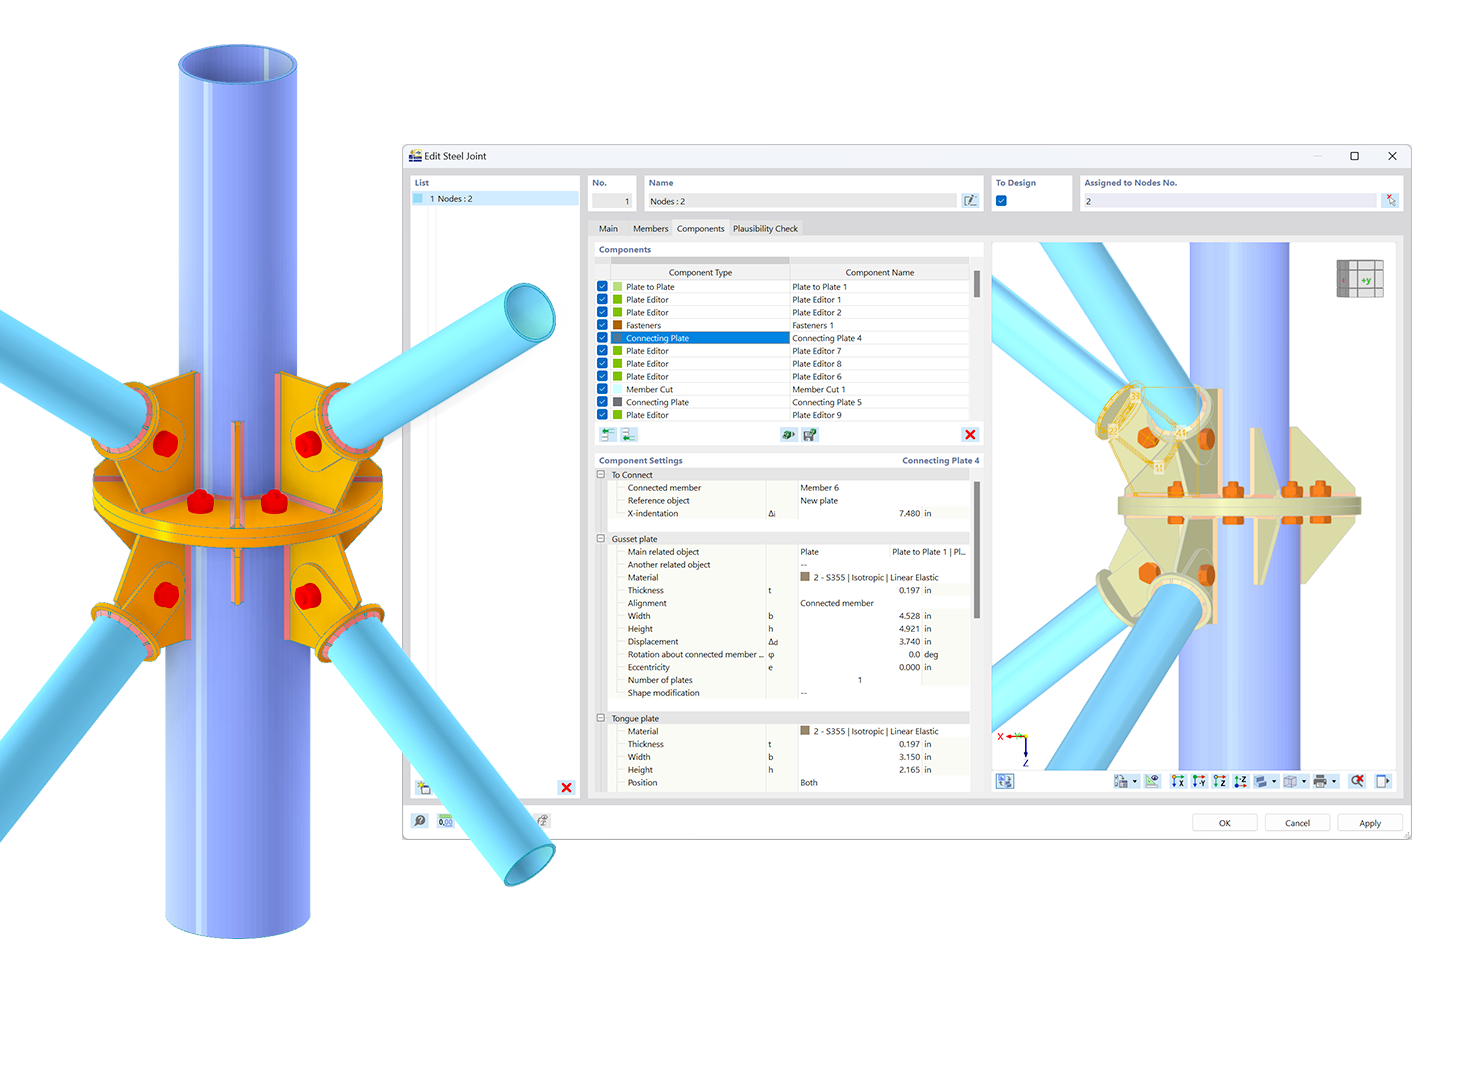
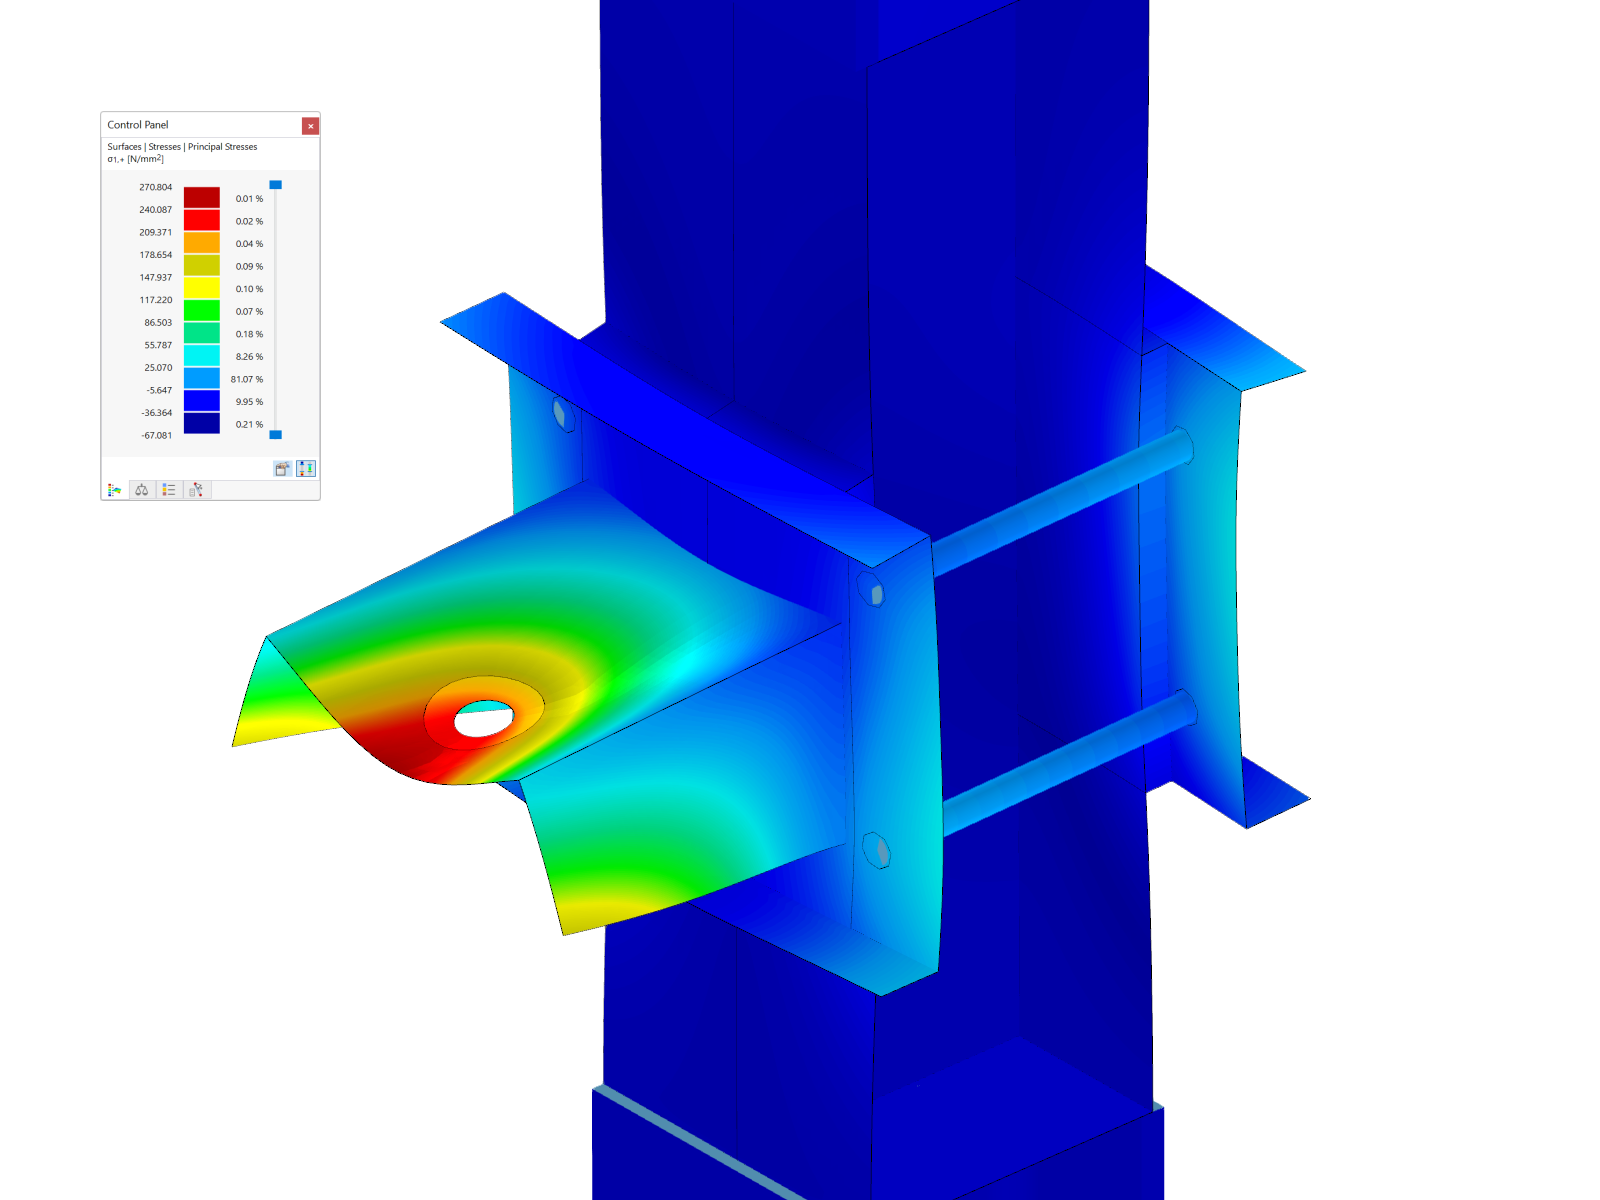
The Steel Joints add-on for RFEM allows you to analyze steel connections using an FE model. The FE model is generated automatically in the background and can be controlled via the simple and familiar input of components.
The Torsional Warping (7 DOF) add-on allows you to consider cross-section warping as an additional degree of freedom.
The Nonlinear Material Behavior add-on allows you to consider material nonlinearities in RFEM for example, isotropic plastic, orthotropic plastic, isotropic damage).
The Structure Stability add-on performs stability analysis of structures. It determines critical load factors and the corresponding stability modes.
The Time-Dependent Analysis (TDA) add-on allows you to consider the time-dependent material behavior of members and surfaces. The long-term effects, such as creep, shrinkage, and aging, can influence the distribution of internal forces, depending on the structure.
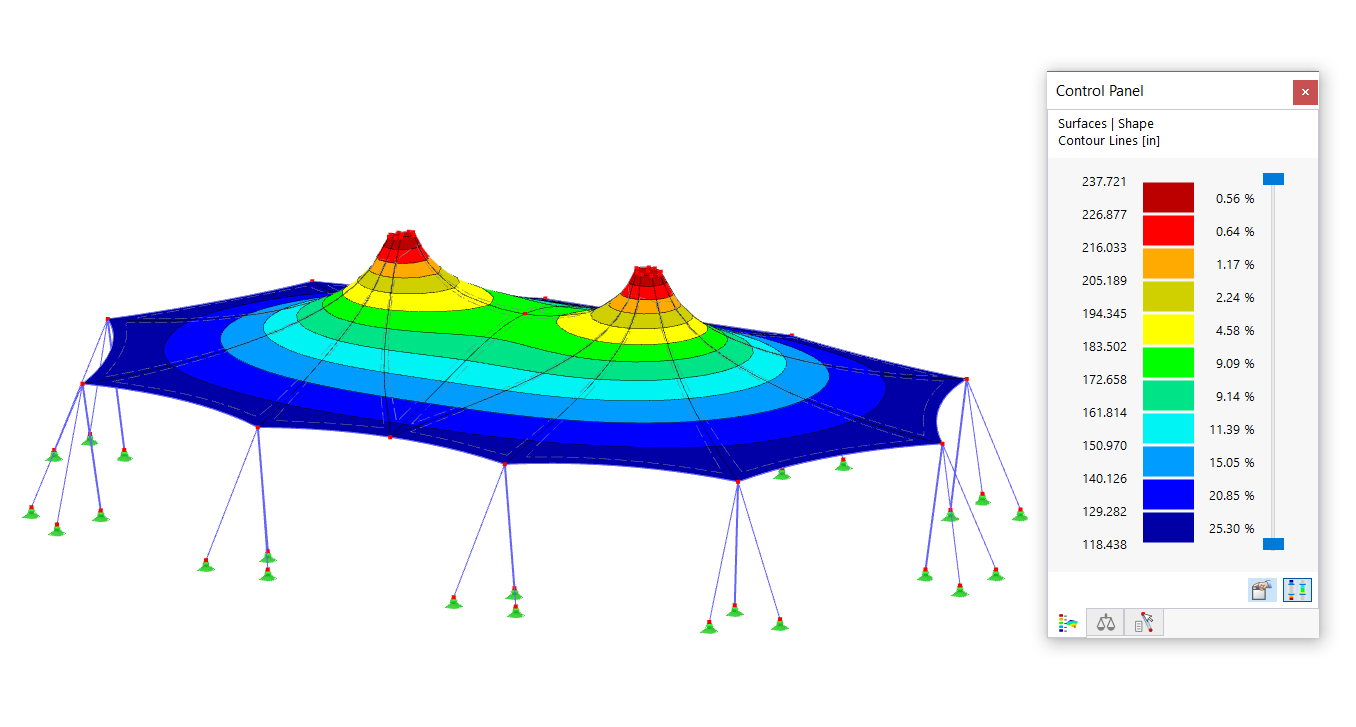
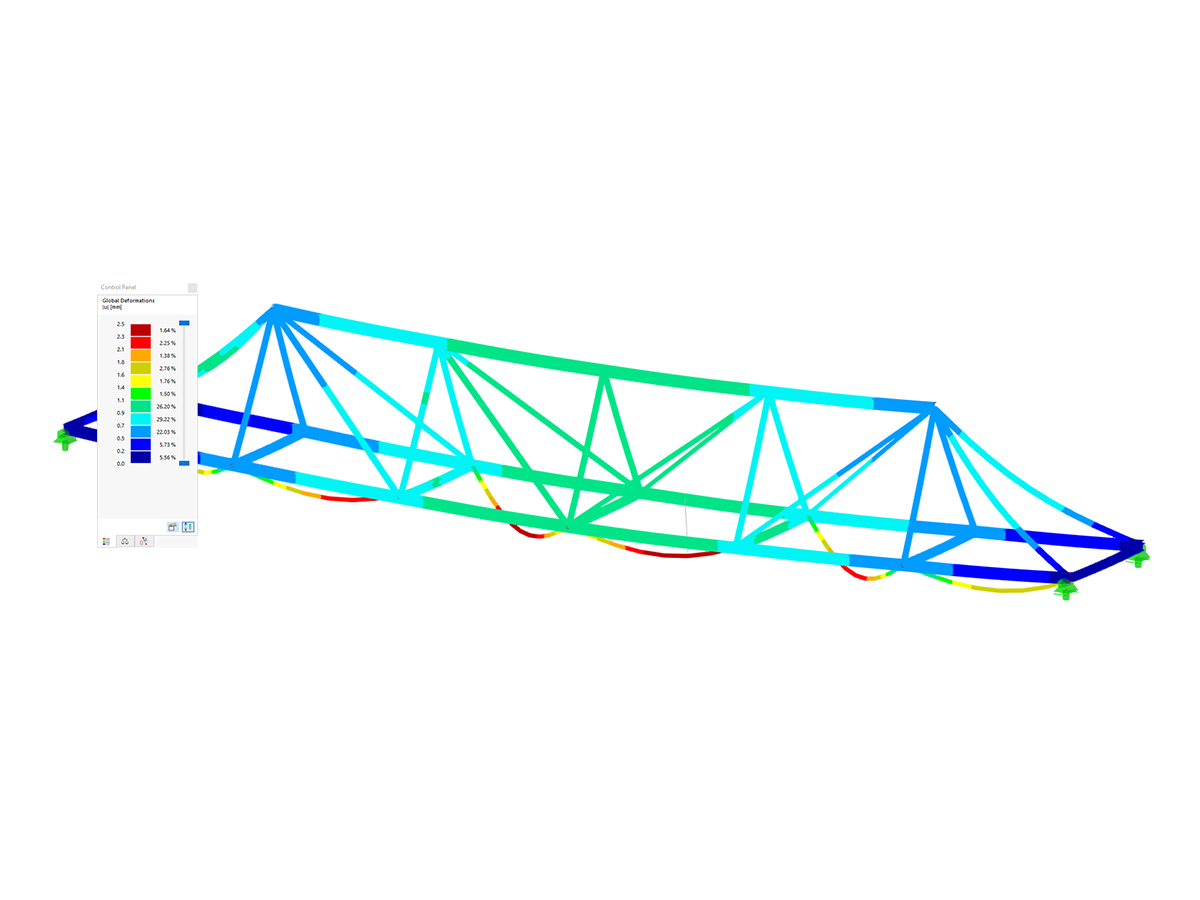
The Form-Finding add-on finds the optimal shape of members subjected to axial forces and tension-loaded surface models. The shape is determined by the equilibrium between the member axial force or the membrane stress and the existing boundary conditions.
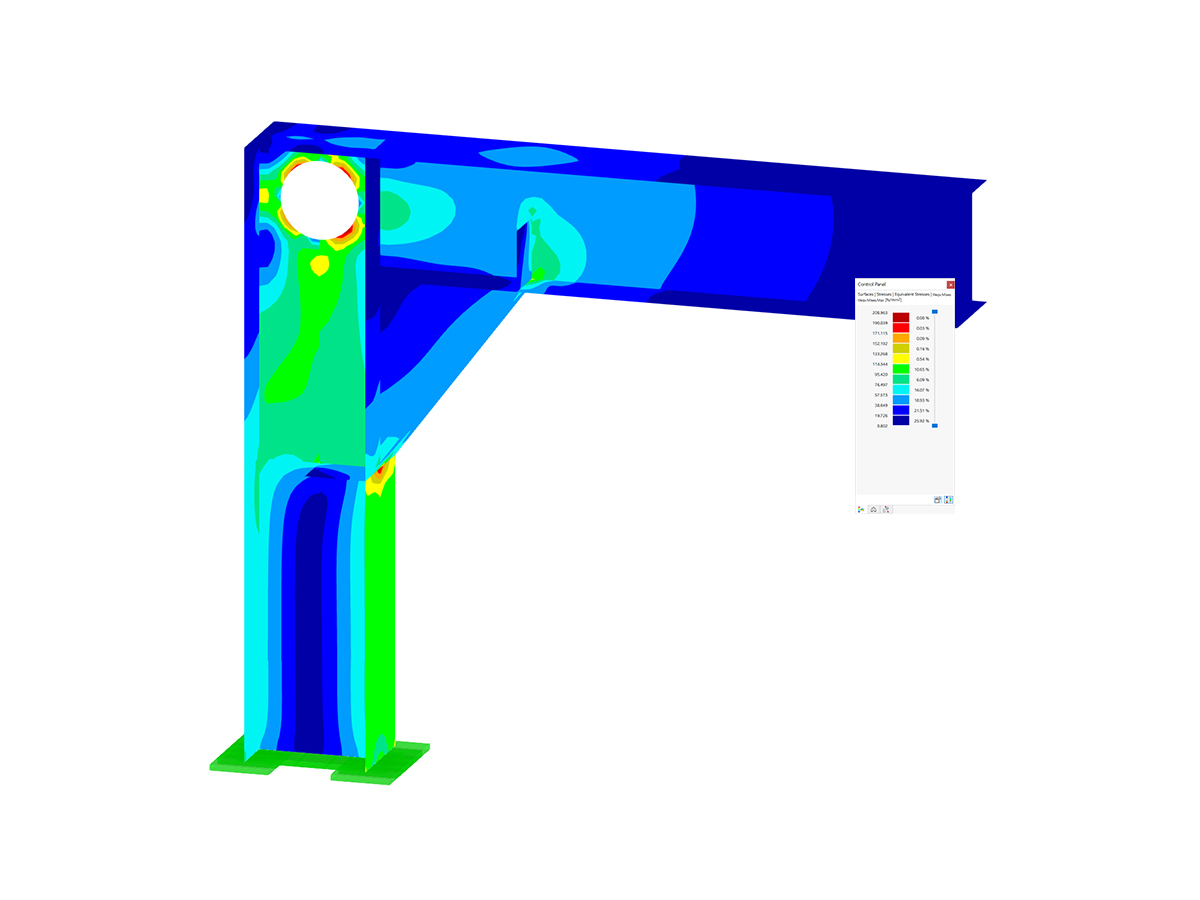
The Stress-Strain Analysis add-on performs general stress analysis by calculating the existing stresses and comparing them with the limit stresses.
The modern 3D structural analysis and design program is suitable for the structural and dynamic analysis of beam structures as well as the design of concrete, steel, timber, and other materials.
The Steel Design add-on performs the ultimate and serviceability limit state design checks of steel members according to various standards.
The Structure Stability add-on performs the stability analysis of structures. It determines critical load factors and the corresponding stability modes.
The Stress-Strain Analysis add-on performs a general stress analysis by calculating the existing stresses and comparing them to the limit stresses.
The Torsional Warping (7 DOF) add-on allows for considering cross-section warping as an additional degree of freedom when calculating members.
The Modal Analysis add-on allows for the calculation of eigenvalues, natural frequencies, and natural periods for member, surface, and solid models.
Earthquakes may have a significant impact on the deformation behavior of buildings. A pushover analysis allows you to analyze the deformation behavior of buildings and compare them with seismic actions. Using the Pushover Analysis add-on, you can analyze the seismic actions on a particular building, and thus assess whether the building can withstand the earthquake.
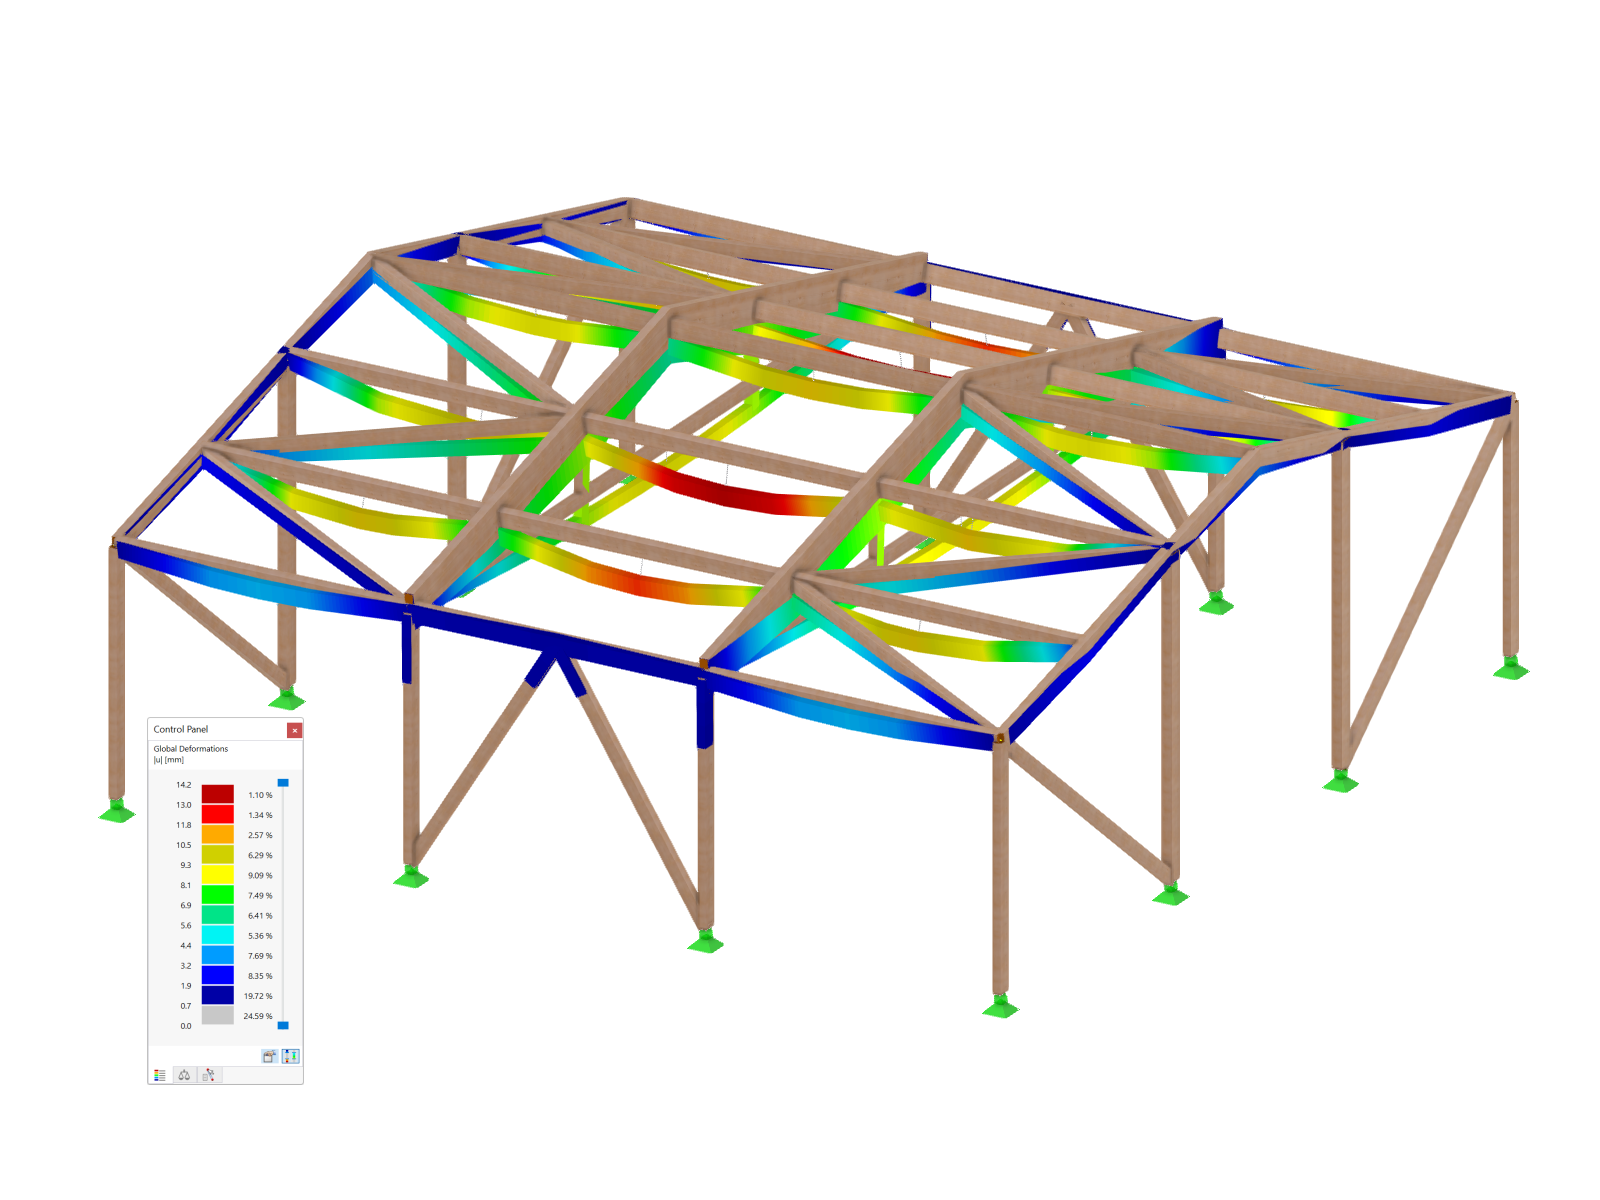
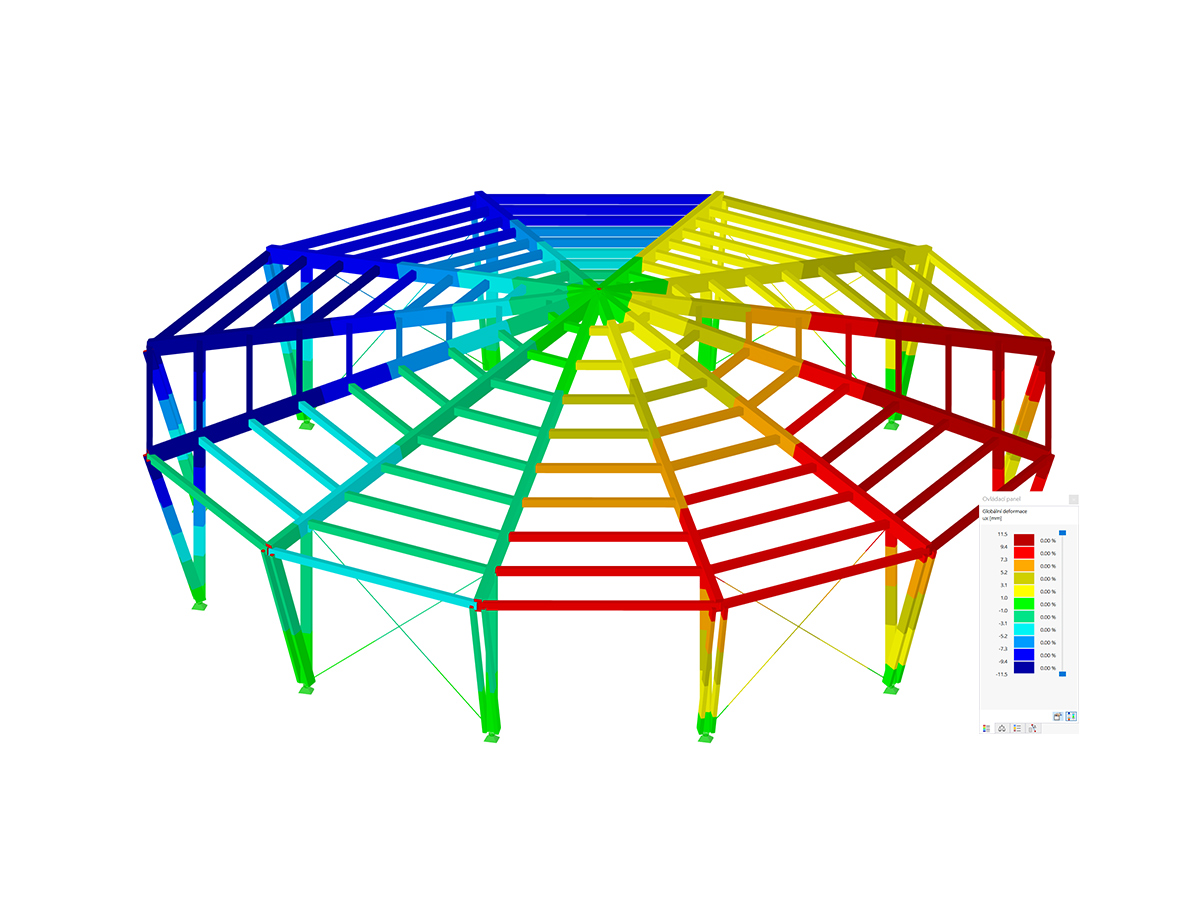
The Timber Design add-on performs the ultimate, serviceability, and fire resistance limit state design checks of timber members according to various standards.
The Timber Design add-on performs the ultimate, serviceability, and fire resistance limit state design checks of timber members according to various standards.

Timber design of single-span and wide-span glulam beams according to Eurocode 5 or DIN 1052

Timber design of simple, continuous, and Gerber beams with or without cantilever according to Eurocode 5 or DIN 1052

Timber design of rectangular and circular columns according to Eurocode 5 or DIN 1052

Timber design of coupled purlins and continuous beams according to Eurocode 5 or DIN 1052

Timber design of three-hinged frames with finger joint connections according to Eurocode 5 or DIN 1052

Timber design of stiffening truss bracing according to Eurocode 5 or DIN 1052

Timber design of flat, monopitch, and duopitch roofs according to Eurocode 5
The Multilayer Surfaces add-on allows you to define multilayer surface structures. The calculation can be carried out with or without the shear coupling.
The two-part Optimization & Costs / CO2 Emission Estimation add-on finds suitable parameters for parameterized models and blocks via the artificial intelligence (AI) technique of particle swarm optimization (PSO) for compliance with common optimization criteria. Furthermore, this add-on estimates the model costs or CO2 emissions by specifying unit costs or emissions per material definition for the structural model.
The Aluminum Design add-on performs the ultimate and serviceability limit state design checks of aluminum members according to various standards.
The two-part Optimization & Costs / CO2 Emission Estimation add-on finds suitable parameters for parameterized models and blocks via the artificial intelligence (AI) technique of particle swarm optimization (PSO) for compliance with common optimization criteria. Furthermore, this add-on estimates the model costs or CO2 emissions by specifying unit costs or emissions per material definition for the structural model.
Concrete Design add-on allows for various design checks of members and columns according to international standards.
The Aluminum Design add-on performs the ultimate and serviceability limit state design checks of aluminum members according to various standards.


.png?mw=350&hash=c6c25b135ffd26af9cd48d77813d2ba5853f936c)


_1.jpg?mw=350&hash=ab2086621f4e50c8c8fb8f3c211a22bc246e0552)