Answer:
ParaView is an open-source data visualization and post-processing tool used for large-scale scientific data analysis. It is widely used in CFD, including RWIND, to analyze and visualize flow fields and presenting corresponding data.
- How RWIND and ParaView Work Together
Step 1) Run RWIND: Simulate wind flow around your model, then you can go to the working directory to access temporary files according to Image 1:

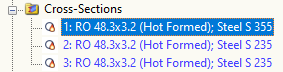
Step 2) Navigate to the RF-Simul folder and open the .VTP files in ParaView, as shown in Image 2.

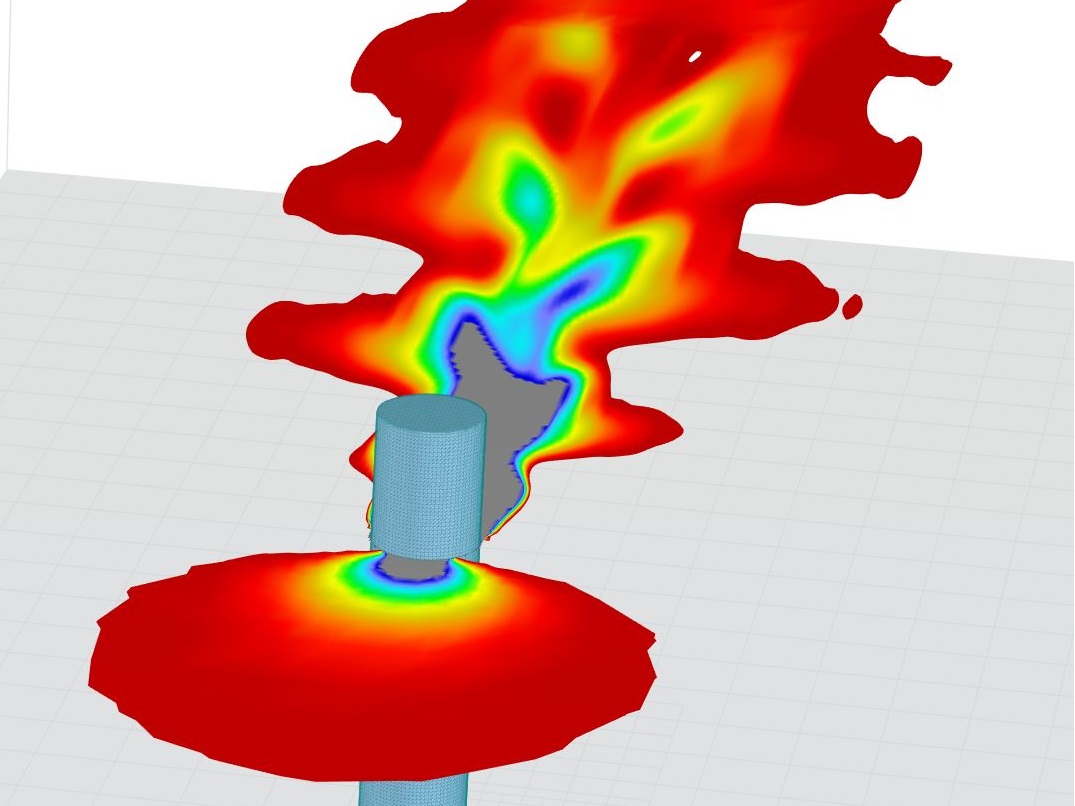
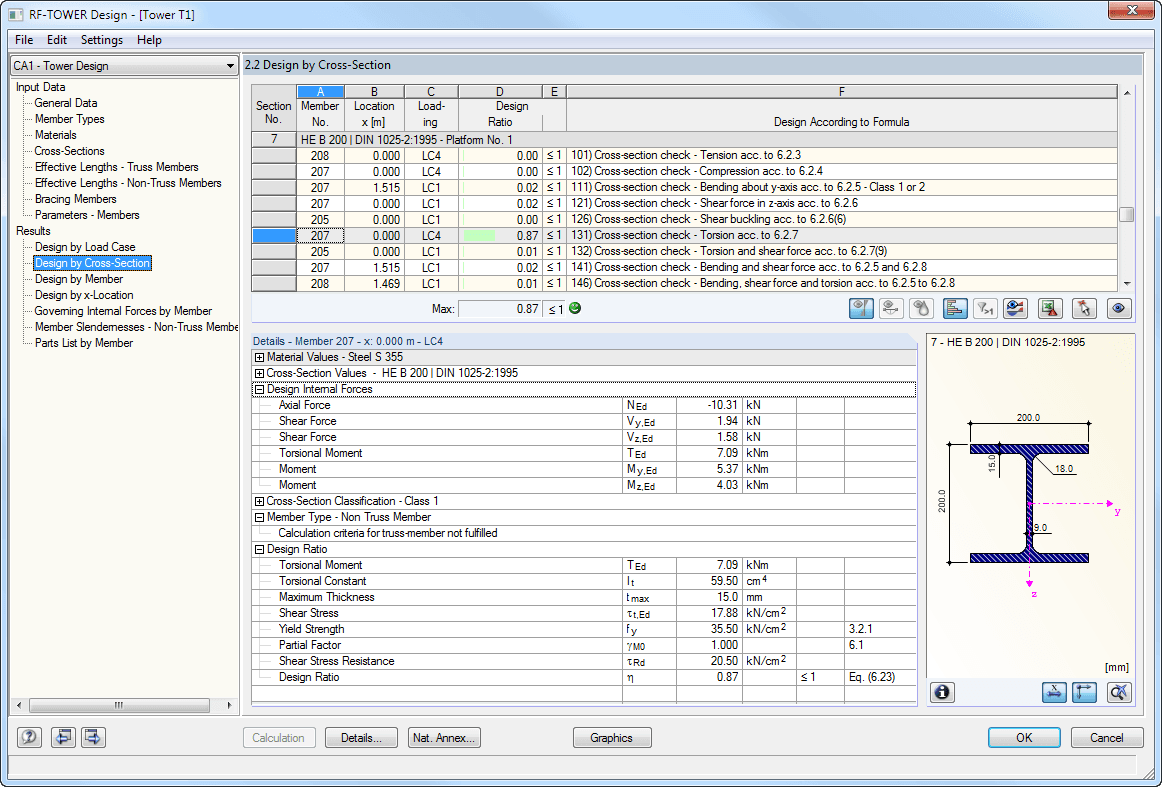
Step 3) Image 3 represents structural force data where the "force" data can be selected from the dropdown menu, and the corresponding numerical data are displayed in the spreadsheet view. The visualization helps analyze how forces are distributed across the structure, allowing the user to receive more data as a spreadsheet from CFD in ParaView.

.VTP data is available to download in the following link:
ParaView Data


.png?mw=350&hash=f79867dbf405d536638daef39ee25b113e6e540d)


.png?mw=600&hash=49b6a289915d28aa461360f7308b092631b1446e)