Odpověď:
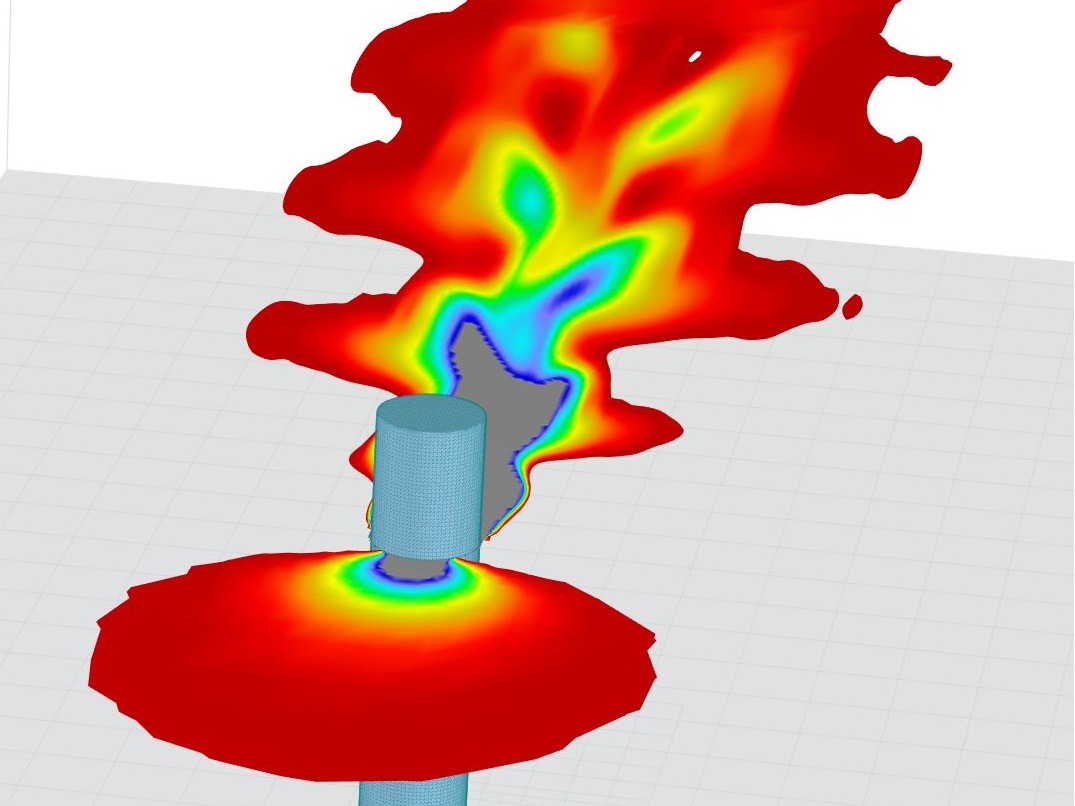
ParaView je open-source nástroj pro vizualizaci dat a následné zpracování, který se používá pro analýzu vědeckých dat ve velkém měřítku. Je široce používán v CFD, včetně RWIND, pro analýzu a vizualizaci proudových polí a prezentaci příslušných dat.
- Jak RWIND a ParaView spolupracují
Krok 1) Spusťte RWIND: Simulujte proudění větru kolem vašeho modelu, poté můžete přejít do pracovního adresáře pro přístup k dočasným souborům podle Obrázku 1:

Krok 2) Přejděte do složky RF-Simul a otevřete soubory .VTP v ParaView, jak ukazuje Obrázek 2.

Krok 3) Obrázek 3 představuje data strukturálních sil, kde lze z rozbalovacího menu vybrat data "síly" a příslušná číselná data se zobrazí ve zobrazení tabulky. Vizualizace pomáhá analyzovat, jak jsou síly rozloženy na konstrukci, což uživateli umožňuje přijmout více dat jako tabulku z CFD v ParaView.

.VTP data jsou ke stažení na následujícím odkazu:
ParaView


.png?mw=350&hash=f79867dbf405d536638daef39ee25b113e6e540d)