Introduction
In the field of wind engineering, accurate modeling and validation are critical for ensuring the structural integrity and aerodynamic performance of various wind-sensitive structures such as antennas (Image 1). These structures, often characterized by their slender geometry, light weight, and considerable height, are inherently vulnerable to wind loads. Even moderate wind conditions can impose significant forces on such elements due to their large surface-area-to-mass ratio. Antennas, in particular, require careful attention during the design and analysis process to ensure their stability, functionality, and safety over time. Wind tunnel testing, computational simulations, and field measurements are commonly employed to predict wind pressures and responses accurately. Proper assessment and mitigation strategies are essential not only to prevent structural damage but also to maintain continuous operational performance, especially in critical communication or monitoring applications. In the current validation example, the force coefficient for both CFD simulation in RWIND and experimental study [1] from RWTH Aachen University is investigated.

To address these challenges, rigorous validation of computational models is necessary to ensure that the theoretical predictions align with the real-world performance. One such example is the validation of antenna wind-loading simulations through experimental testing and computational fluid dynamics (CFD) analysis. This process allows engineers to refine their models, improve accuracy, and enhance the overall reliability of antenna structures in various environmental conditions.
In collaboration with RWTH Aachen University, a leading institution in engineering and applied sciences, practical studies are conducted on antenna structures exposed to wind loads. By combining theoretical approaches with empirical data, the research aims to bridge the gap between simulation and reality, contributing to the development of safer, more resilient antenna designs. This study underscores the importance of validation in wind engineering, demonstrating how academic-industry collaboration can lead to more precise modeling techniques and improved structural performance in real-world applications.
Description
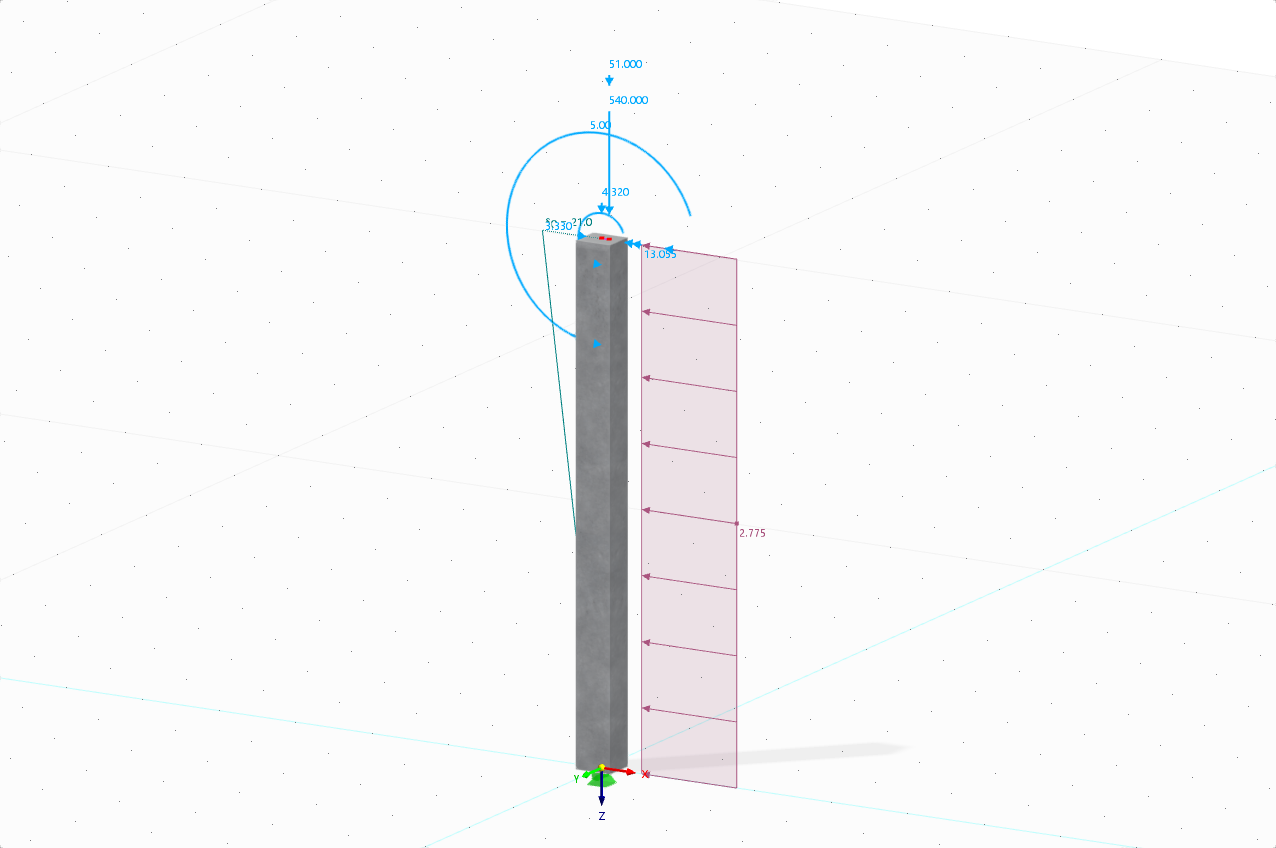
In the current validation example, the force coefficient for both CFD simulation in RWIND and experimental study [1] from RWTH Aachen University is investigated. The model represents three sharp-edged antennas in RWIND, positioned above a grid surface that serves as the ground plane or wind tunnel floor. The model includes several dimensional labels in magenta, indicating specific measurements: the total height of the antenna is 0.50 m; its base is elevated 0.20 m from the ground as shown in image 2.

Input Data and Assumptions
The required assumption of the wind simulation is illustrated in the following table:
| Table 1: Dimensional Ratio and Input Data | |||
| Basic Wind Velocity | V | 10 | m/s |
| Height | href | 0.5 | m |
| Bottom Gap | Gap | 0.20 | m |
| Air Density - RWIND | ρ | 1.25 | kg/m3 |
| Wind Directions | θwind | 0o to 360o with step 30o | Degree |
| Turbulence Model - RWIND | Steady RANS k-ω SST | - | - |
| Kinematic Viscosity - RWIND | ν | 1.5*10-5 | m2/s |
| Scheme Order - RWIND | Second | - | - |
| Residual Target Value - RWIND | 10-4 | - | - |
| Residual Type - RWIND | Pressure | - | - |
| Minimum Number of Iterations - RWIND | 800 | - | - |
| Boundary Layer - RWIND | NL | 10 | - |
| Type of Wall Function - RWIND | Enhanced / Blended | - | - |
| Turbulence Intensity | I | 3% | - |
Computational Mesh Study
A computational mesh study is essential in CFD analysis because it directly affects the accuracy and reliability of results. While a well-refined mesh improves precision, excessive refinement increases computational cost without much benefit. Therefore, mesh sensitivity studies help find the optimal balance between accuracy and efficiency, enabling better decision-making with practical resource use. Displayed table in the lower-right corner is comparing various mesh densities ranging from 10% to 30% and their corresponding force coefficients (Cf).

More info about computational mesh study:
Results and Discussion
Image 4 presents an analysis comparing experimental and simulated data related to the wind force coefficient acting on the antenna structure. At the center of the image, a line graph illustrates the variation of the force coefficient Cf as a function of wind direction θ, measured in degrees from 0∘ to 360∘. The vertical axis represents the force coefficient Cf, ranging from 0.0 to 1.0 , and the horizontal axis represents wind directions at 30 degree intervals. Two data sets are plotted on the graph: the black line with triangular markers represents experimental measurements, while the green line with circular markers represents simulation results obtained using the RWIND.
More info about how to calculate wind force coefficient in RWIND:
The graph shows that both experimental and RWIND results follow a similar trend, indicating a high level of agreement between the two. In general, the force coefficient exhibits a periodic behavior, with noticeable dips at wind directions of approximately 60∘ and 180∘, where the values of Cf are at their lowest. Peaks are observed at around 0∘, 120∘,240∘, and 330∘, where the structure is experiencing the highest wind-induced forces. The close alignment of the two curves illustrates that RWIND accurately captures the aerodynamic response of the structure, with a reported average deviation around 5% from the experimental data.

Overall, the current study effectively investigates the process of validating a numerical wind simulation against physical experiment results. It shows that RWIND performs very well in replicating the experimental data across various wind directions, suggesting its suitability for predicting wind loads on slender vertical structures like antenna masts. The combination of graphical data, structural visuals, and flow field simulation provides a clear and well-rounded depiction of the study’s methodology and results.
Also, the example of the single sharp-edge antenna from RWTH Aachen University is here:


..png?mw=320&hash=bd2e7071b02d74aef6228d22c4b83867d2d7e1a5)


.png?mw=600&hash=49b6a289915d28aa461360f7308b092631b1446e)