User Story
In this example, we are going to calculate averaged force values for a bridge section, such as those applicable to structural sections in the design process based on WTG-Merkblatt-M3
This example belongs to Group 1 according to Figure 2.2 in WTG-Merkblatt-M3 is:
- G2: Absolute values with medium accuracy requirements. The area of application can include parameters or preliminary studies when later investigations with higher accuracy are planned (e.g., wind tunnel examination of class G3).
- R2: Solitary, all relevant wind directions with sufficiently fine directional resolution.
- Z1: Statistical mean values, provided they concern stationary flow processes where fluctuations (e.g., due to approaching flow turbulence) can be sufficiently captured by other measures.
- S1: Static effects. It is sufficient to represent the structural model with the necessary mechanical detail, but without mass and damping properties.
The dimensions of the example are shown in Figure 1, and the input assumption is illustrated in Table 1:
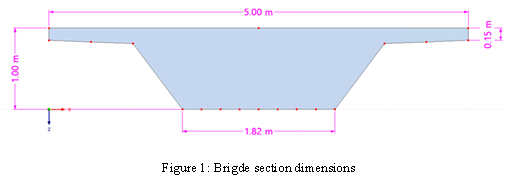
Table 1: Input Data of the Bridge Section Verification Example
| Model | Bridge Section |
|---|---|
| Basic wind speed | V = 30 m/s |
| Air density | ρ = 1.225 kg/m³ |
| Solver | Pressure-Based |
| Turbulence model | Steady k-ω SST |
| Type of wind velocity profile | Constant in height |
| Turbulence Intensity | 27% |
| Numerical algorithm | SIMPLE algorithm |
| Discretization | Second-Order |
| Residual pressure | 10⁻⁴ |
| Kinematic viscosity | ν = 1.5 × 10⁻⁵ |
Also, the computational mesh study needs to be performed according to the following link:
In this example we will compare the average wind force value in the x-direction between EN 1991-1-4 and RWIND. The force coefficient cfx,o for bridge sections can be obtained using Figure 8.3 in EN 1991-1-4:
Force in X-Direction - Simplified Method
Where it has been assessed that a dynamic response procedure is not necessary, the wind force in the x-direction may be obtained using Expression (8.2) in EN 1991-1-4:
vb=30 m/s is the essential wind speed
C is the wind load factor. C=ce⋅cf,x=1.425×1.3=1.85 , where ce is the exposure factor given in 4.5 and cf,x is given in 8.3.1(1)
Aref,x=5 m2 is the reference area given in 8.3.1
ρ=1.225 kg/m3 is the density of the air
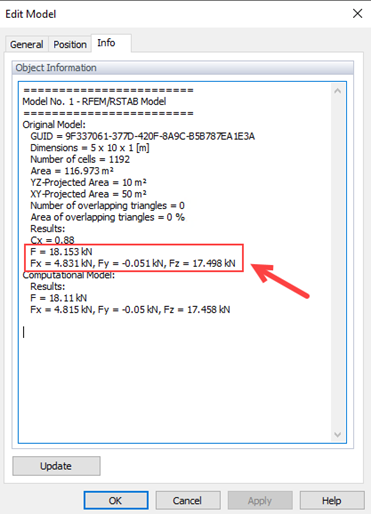
Force Results in RWIND and Comparison to Eurocode
In RWIND the results of the total wind forces are available in the Info tab of the Edit model as shown in Figures 2 and 3. The difference between critical wind direction scenario RWIND (θ=0°) and Eurocode is about 5.36% (less than the criteria in WTG = 10%), which shows acceptable agreement: