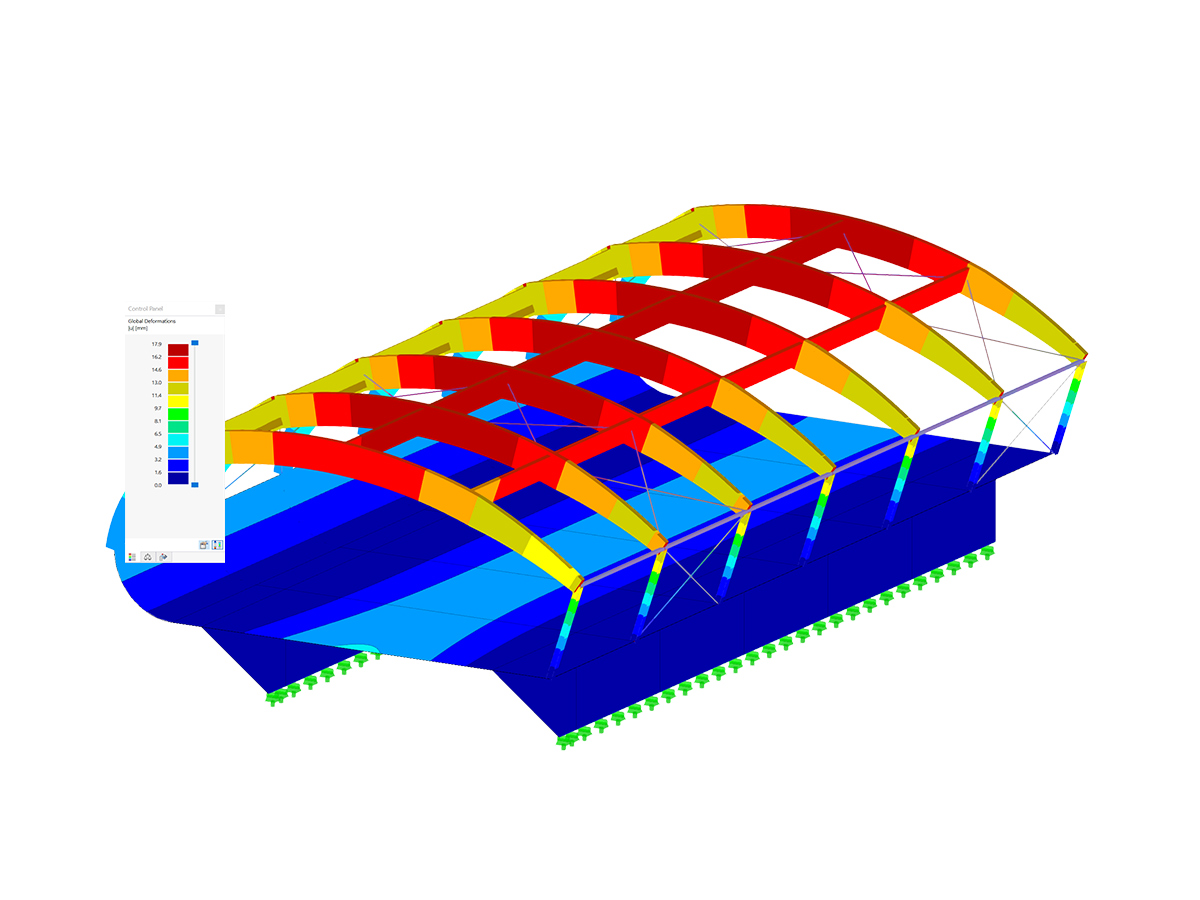
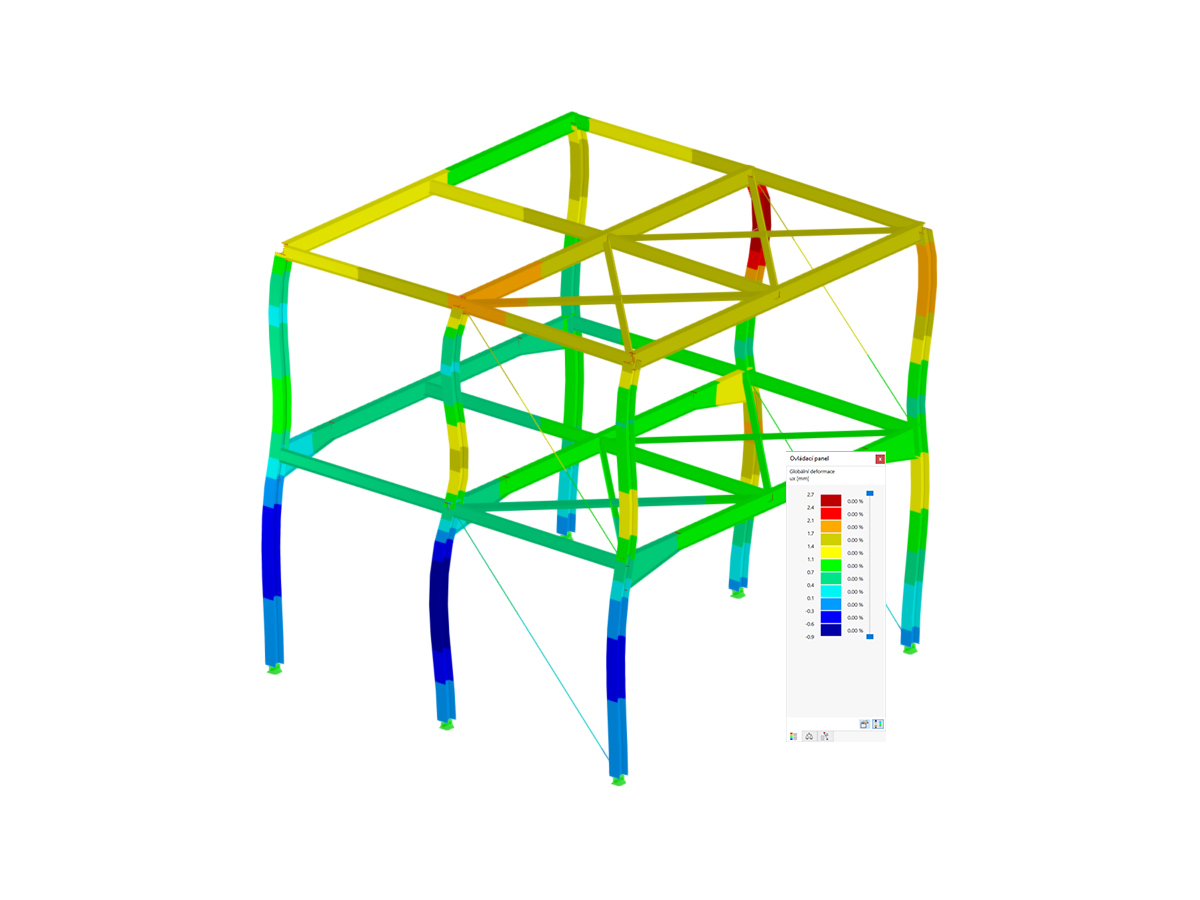
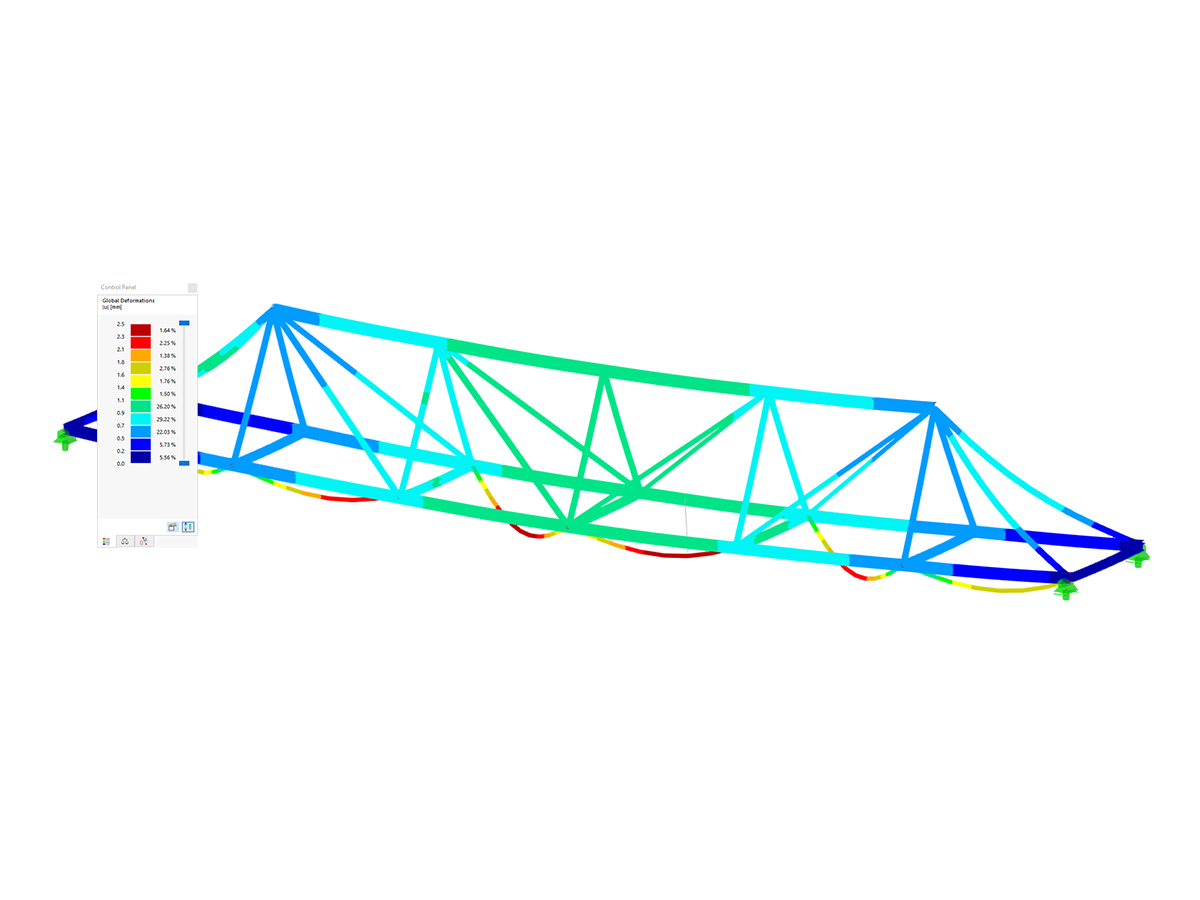
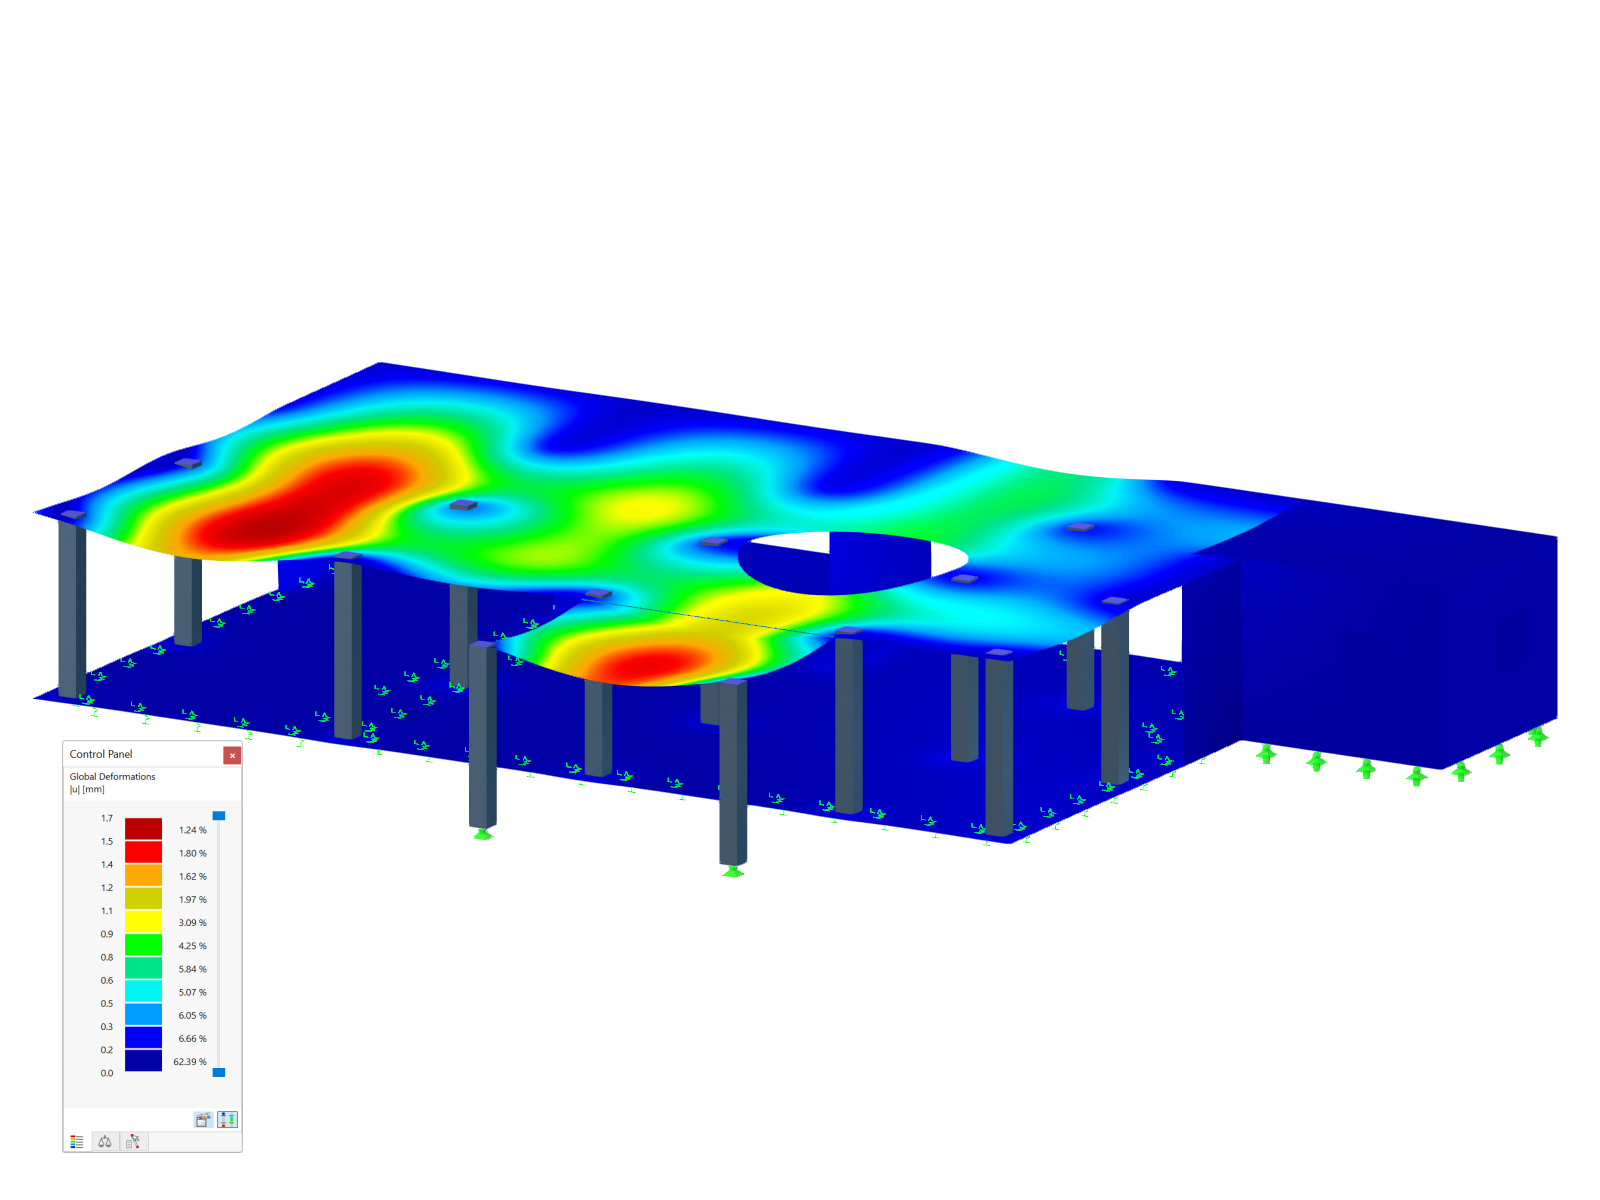
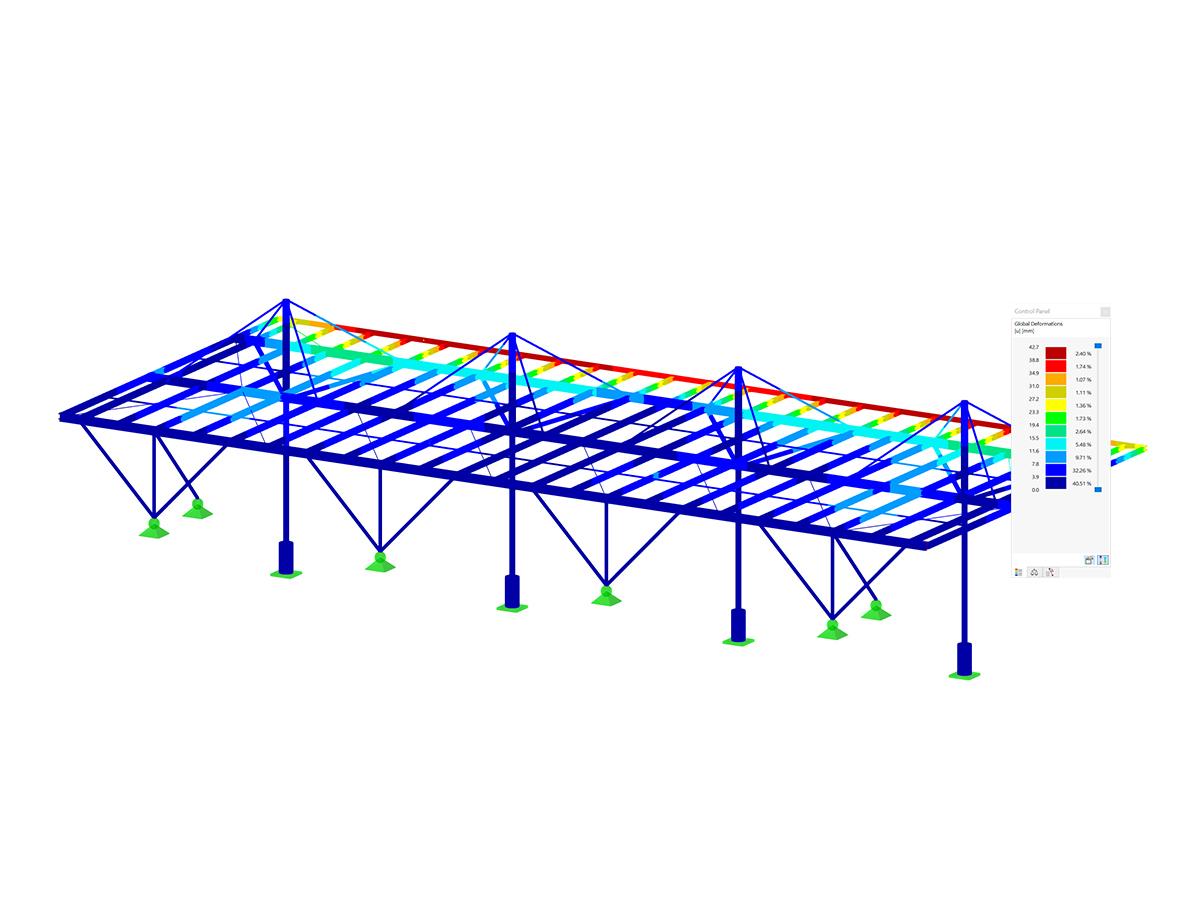
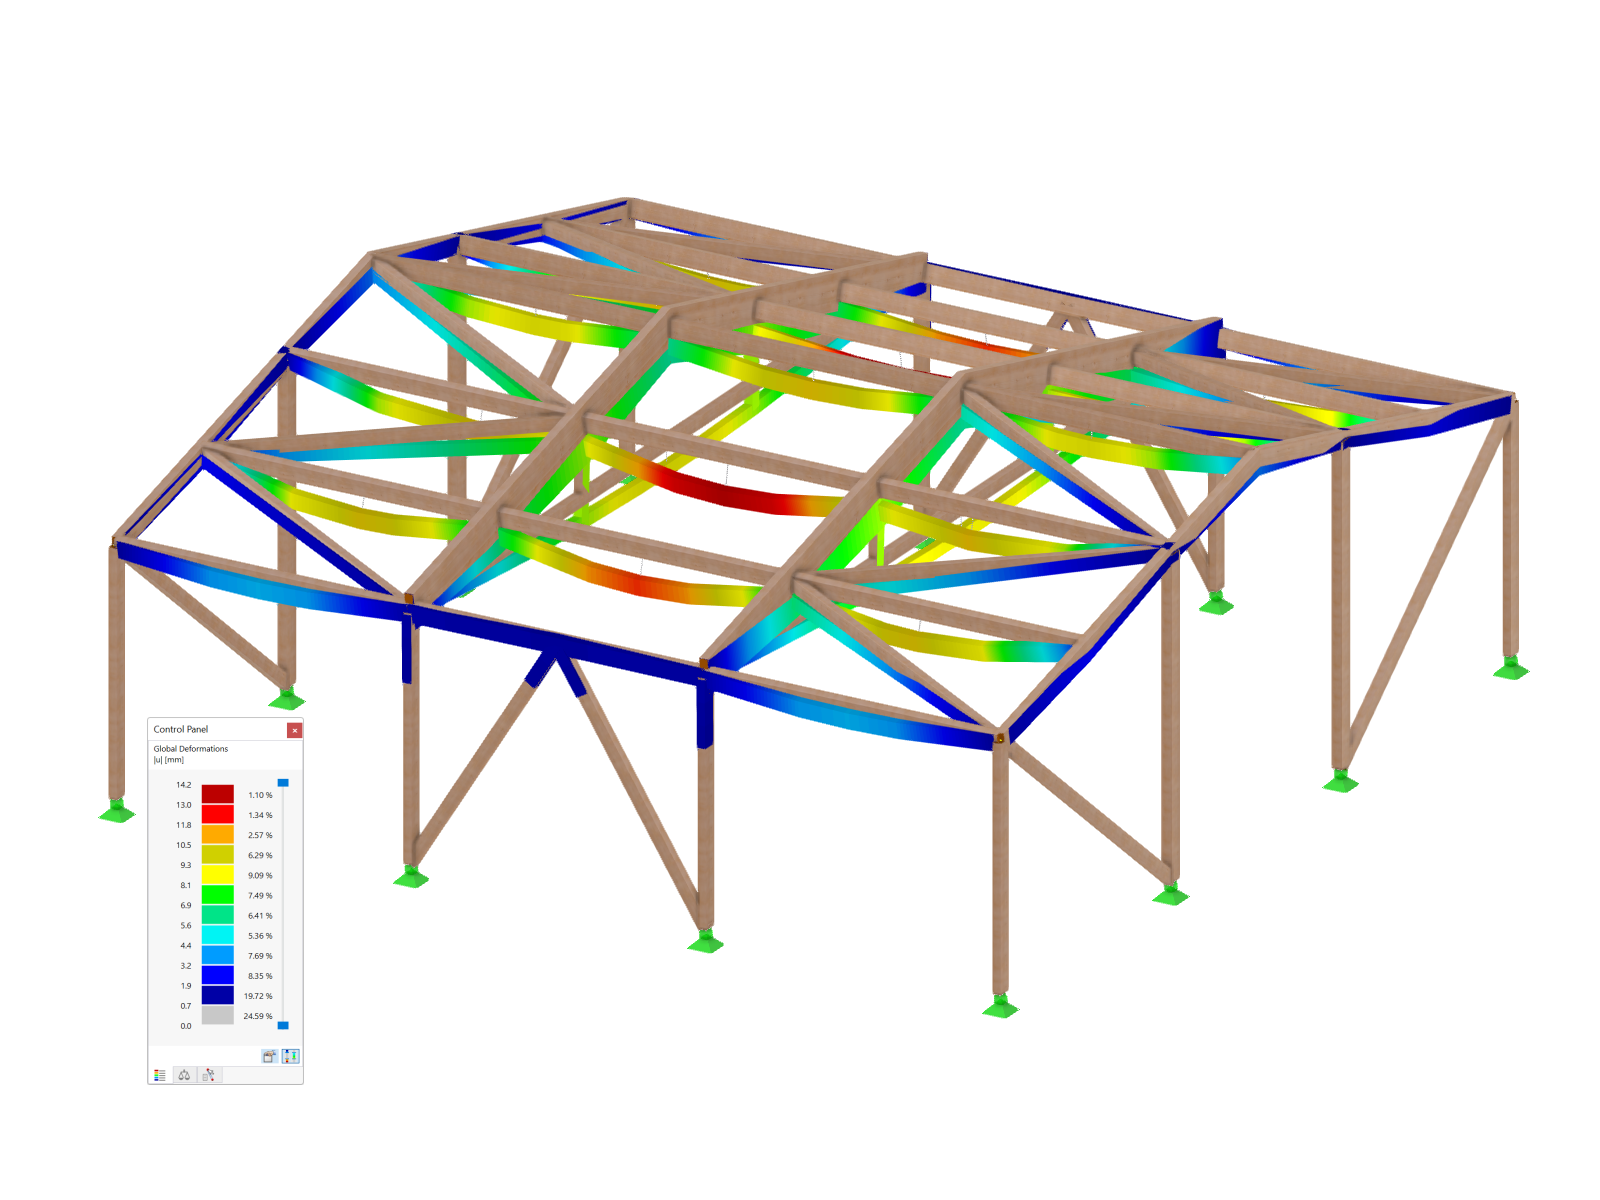
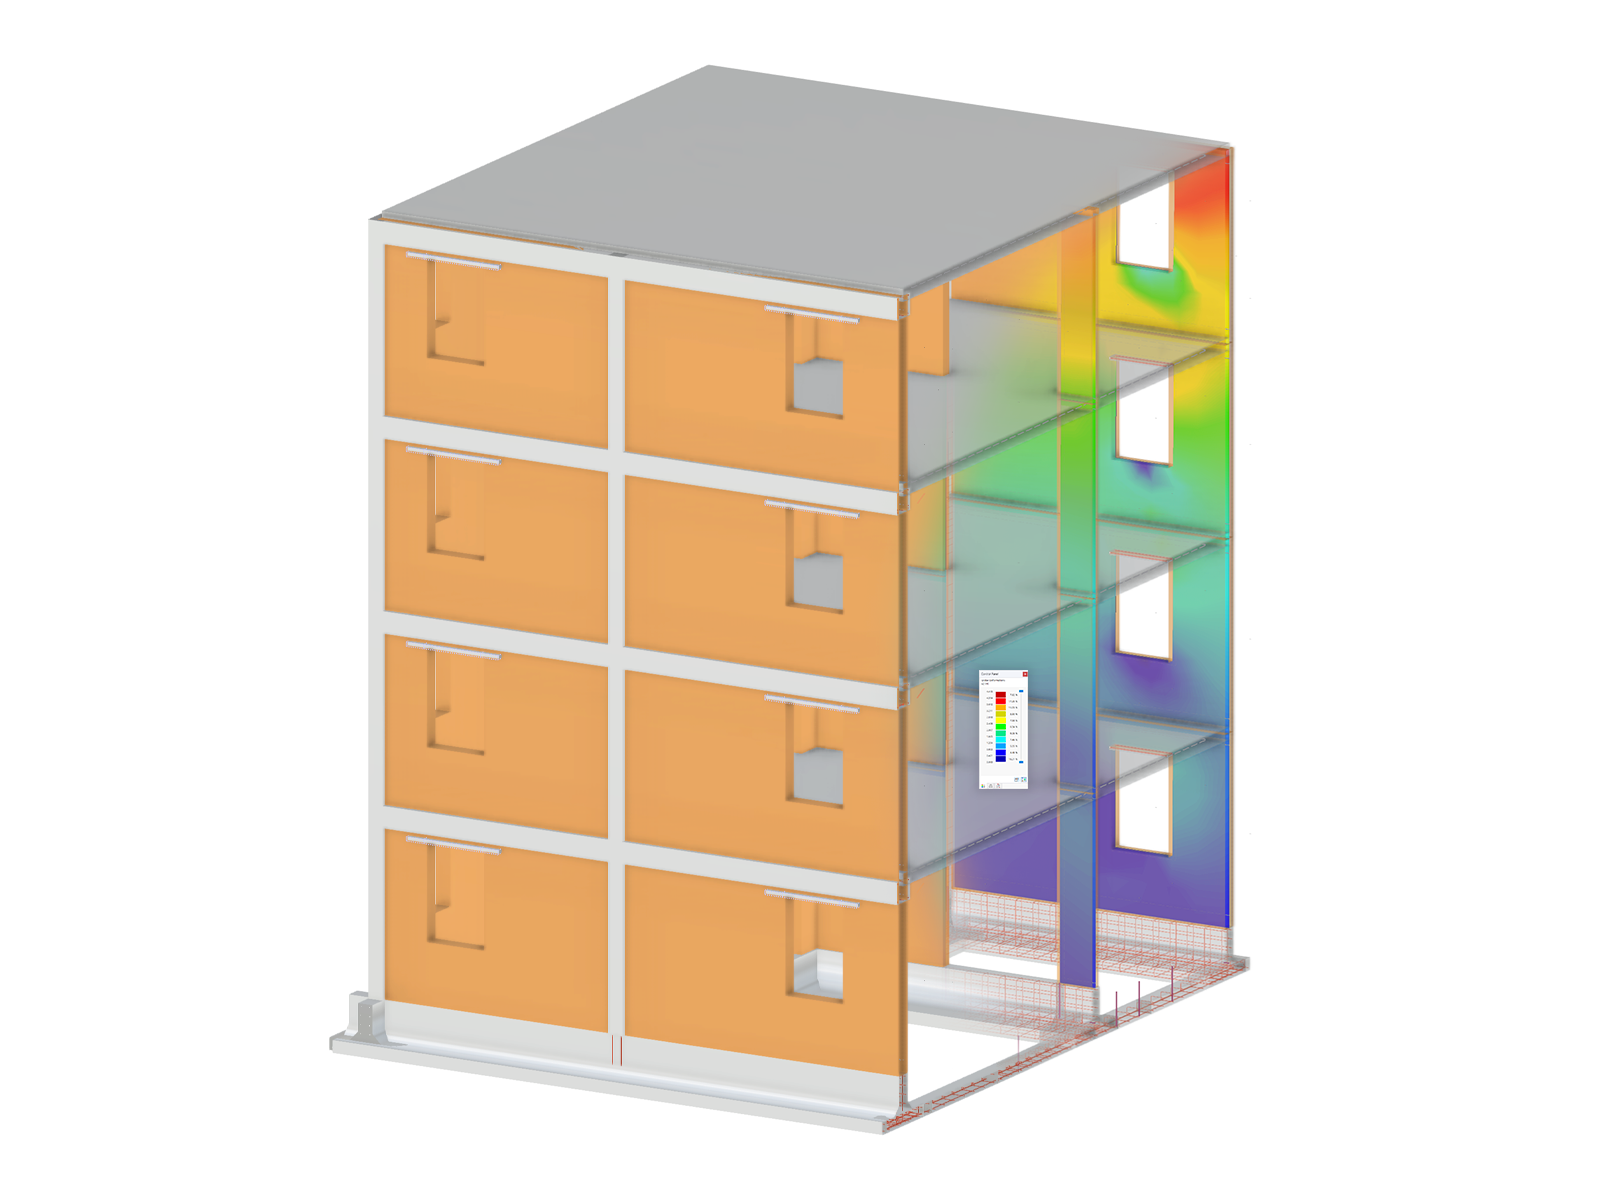
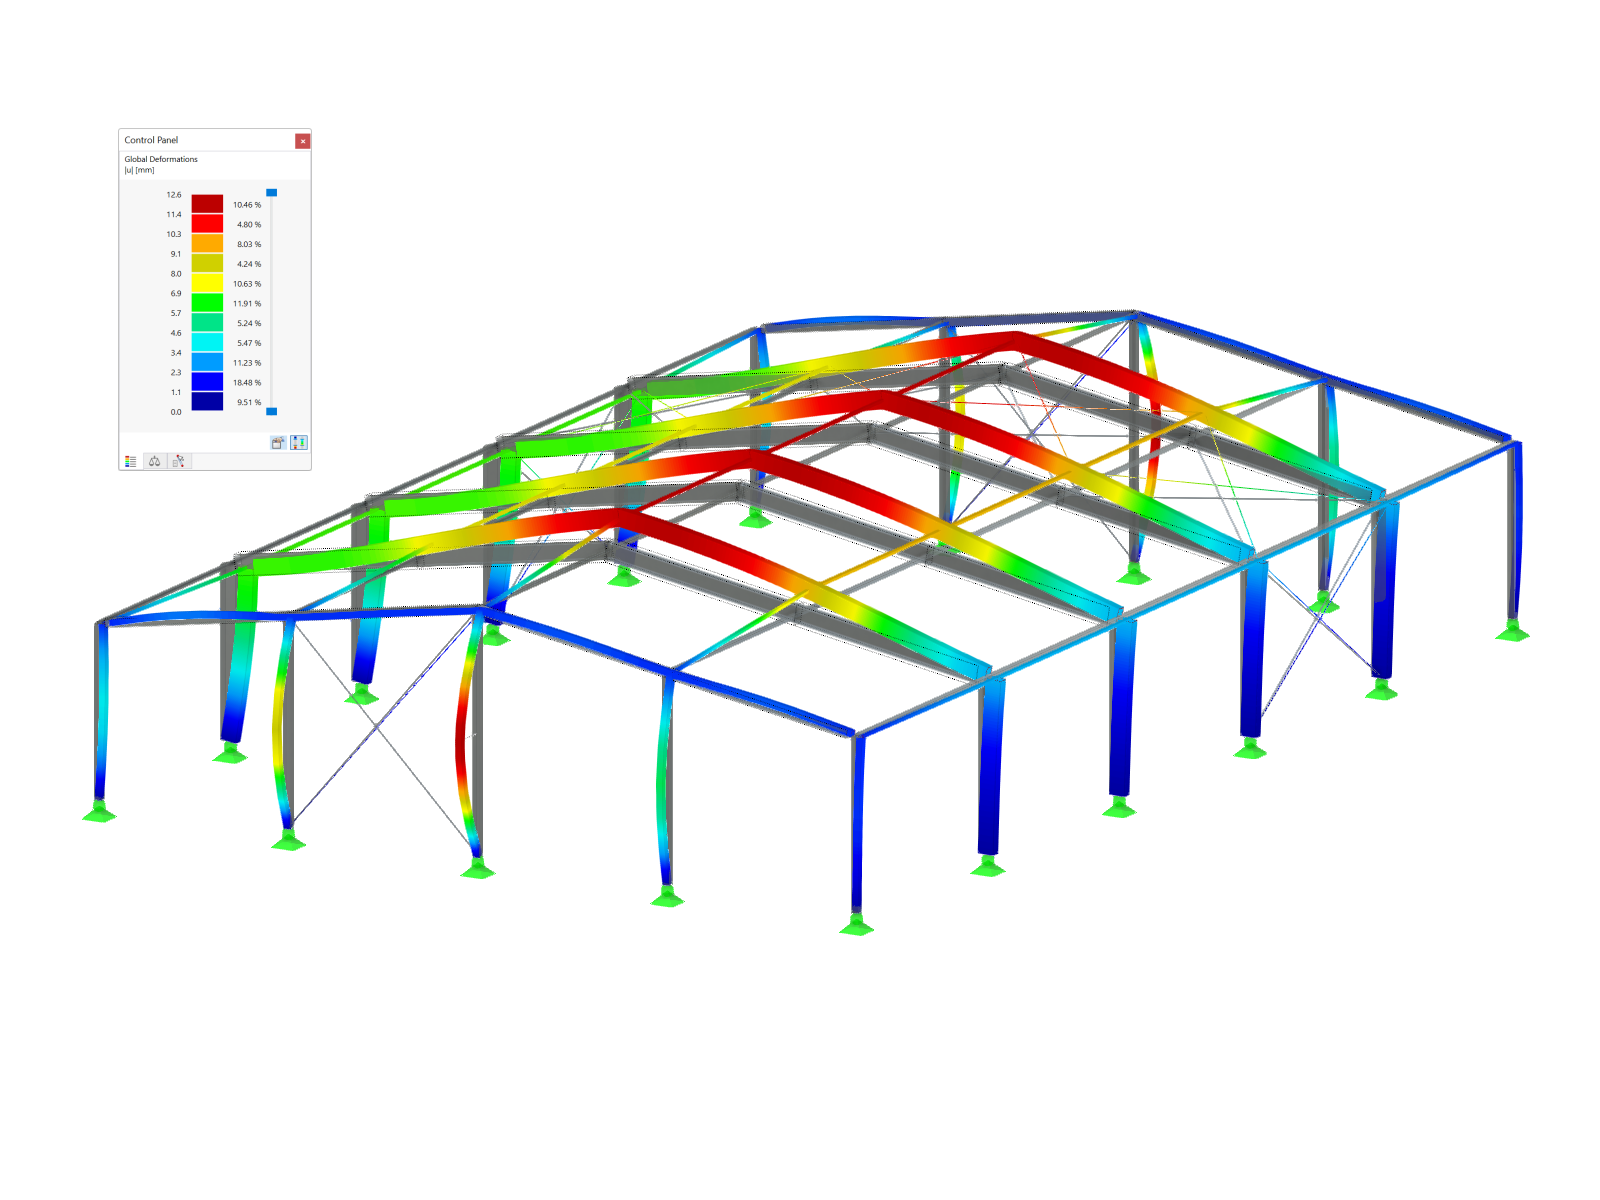
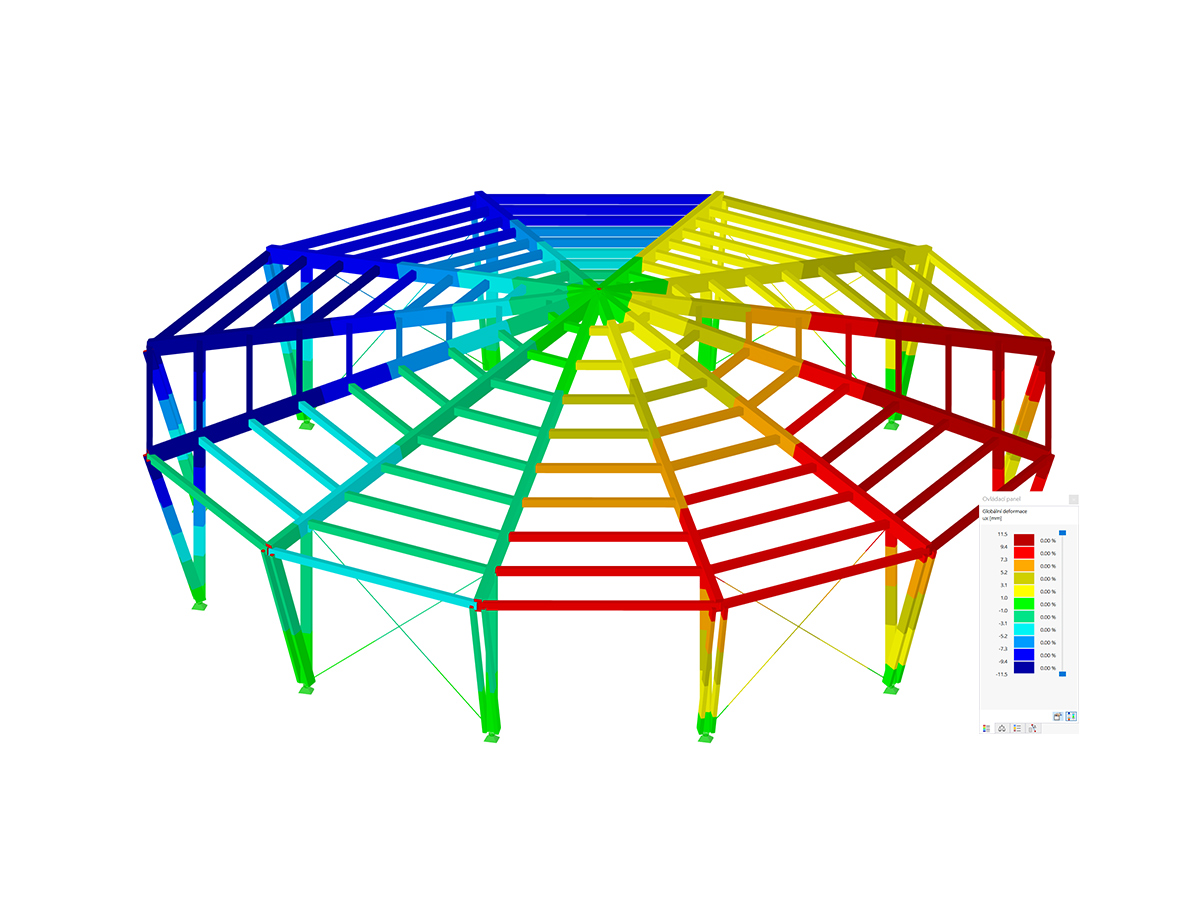
Due to the integration of RF‑/DYNAM Pro in RFEM / RSTAB, you can incorporate numeric and graphic results from RF‑/DYNAM Pro – Forced Vibrations in the global printout report. Also, all RFEM options are available for a graphical visualization.
The results of the time history analysis are displayed in a time course monitor. All results are displayed as a function of time. You can export the numeric values to MS Excel.
In the case of a time history analysis, you can export results of the individual time steps or filter most unfavourable results of all time steps.
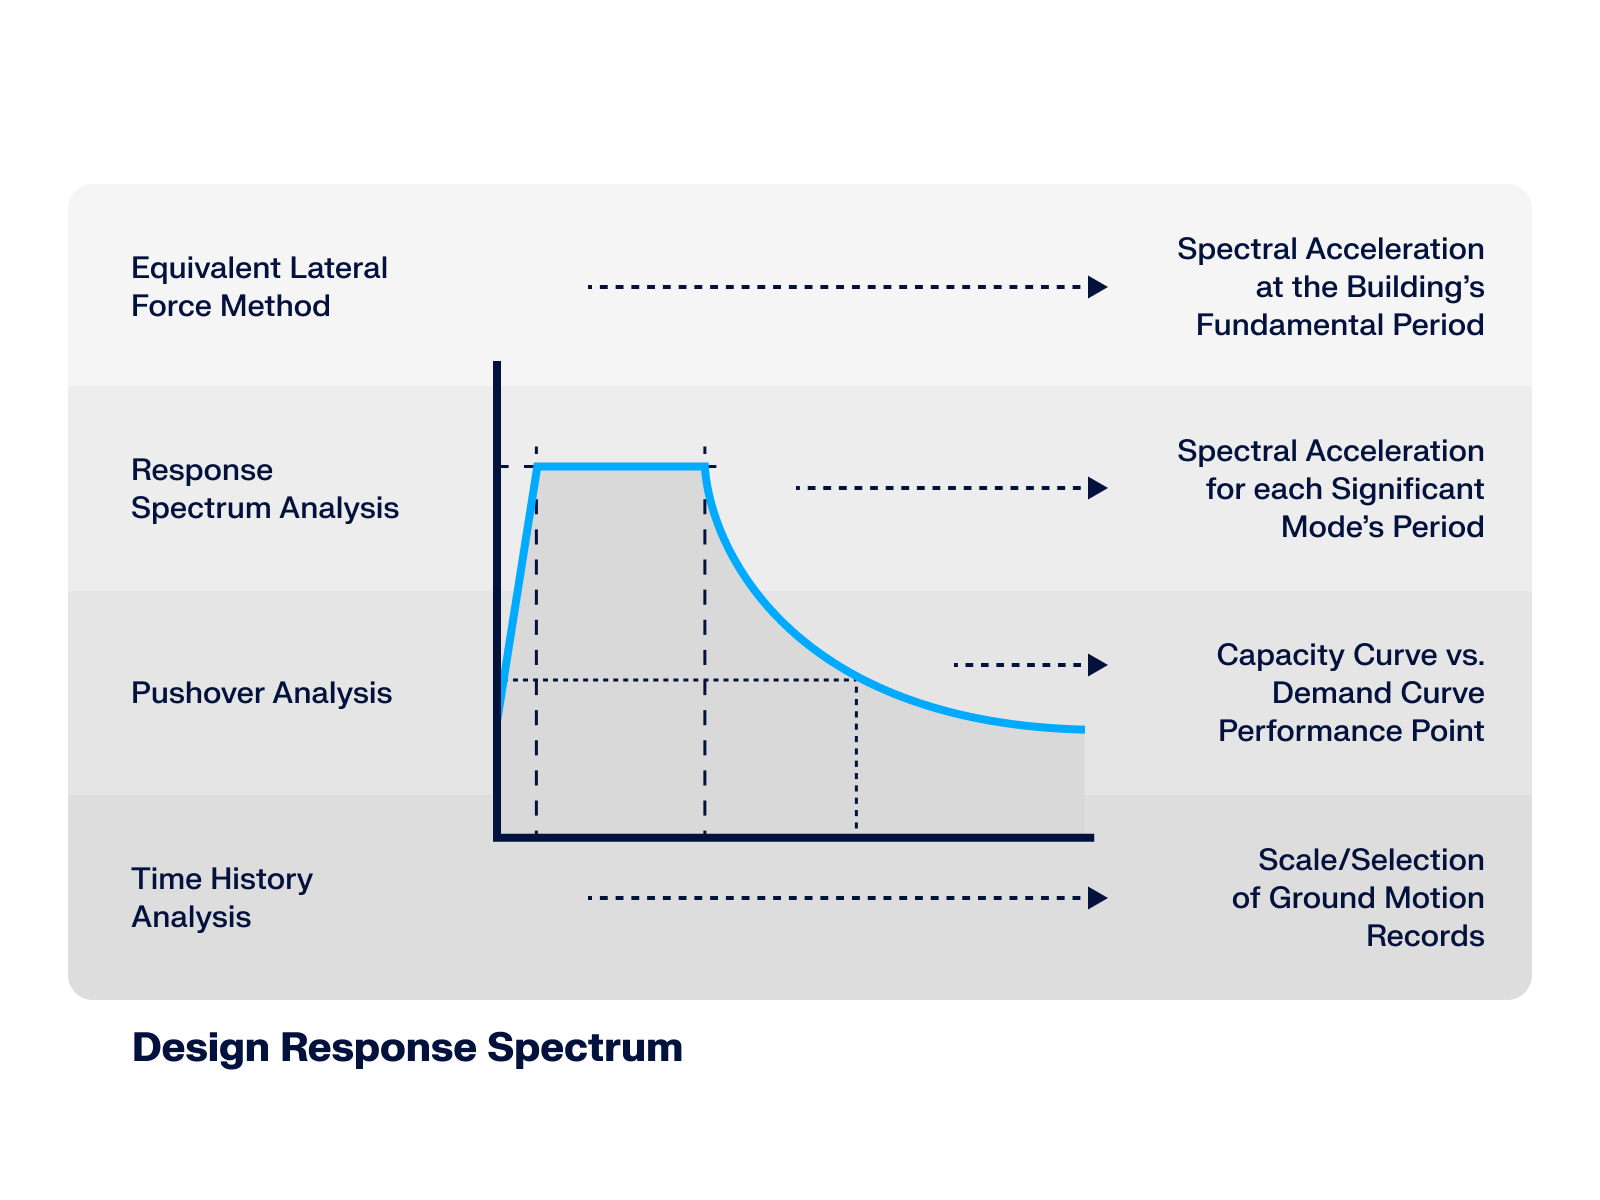
The response spectrum analysis generates result combinations. Internally, the modal contributions and the directional components of earthquake actions are combined.


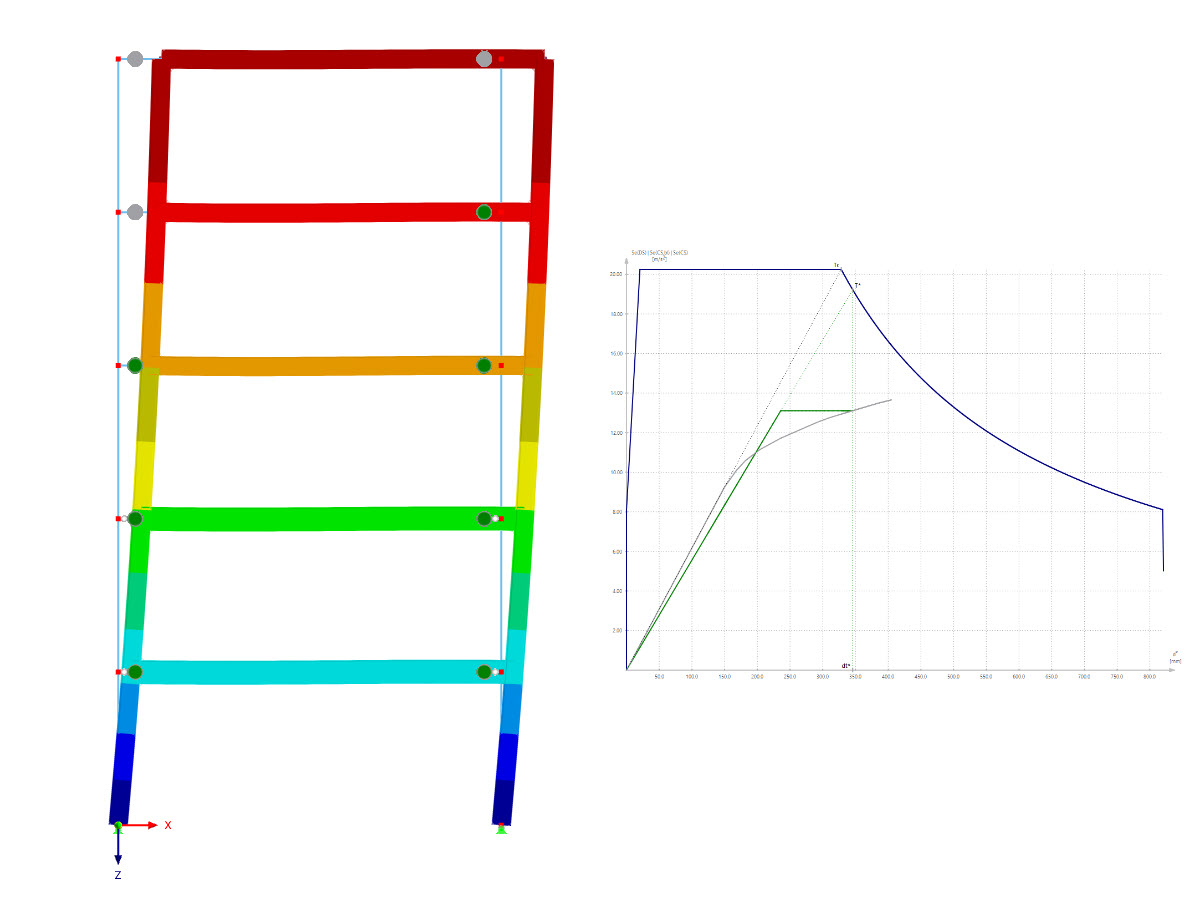
![Reduction of Building to Cantilever Structure: The individual mass points represent the floors. The deflection due to the normal compression forces shown in (a) is (b) converted into equivalent moments of displacement or shear forces [2].](/en/webimage/009762/2420261/01-en-png-12-png.png?mw=512&hash=8189361dbff525c2ff39c36a72a1ca91810208f6)
