


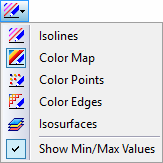
Параметры "Скалярные поля", доступные в навигаторе "Вид", позволяют отображать значения результатов, связанные с каждой точкой модели, различными способами.
В качестве альтернативы выберите параметр Отображение из кнопки Список на панели инструментов.
Обратите внимание, что тип отображения должен соответствовать типу результата: например, изоповерхности, представляющие результаты 3D сетки конечно-объемных элементов, нельзя применять к результатам давления на 2D поверхностях.

Параметр отображения "Цветовая карта" установлен по умолчанию. Он подходит для всех типов результатов и моделей, так как подстраивается автоматически. В панели представлены одиннадцать основных цветов с соответствующими значениями. Вы можете настроить как цвета, так и значения, если это необходимо (см. Главу Цветовая карта).
Изолинии представляют линии точек с равными значениями результатов. По умолчанию, одиннадцать цветов назначаются линиям с равномерно распределёнными значениями. Изолинии могут быть полезны для печати графики на монохромном принтере.
Изоповерхности - это те поверхности, которые имеют идентичные значения с выходными данными 3D сетки конечно-объемных элементов. Эта опция может быть использована для отображения поля давления и результатов поля скоростей. Можно выбрать либо несколько значений по умолчанию, либо одно произвольное значение.

Параметры "Цветные грани" и "Цветные точки" иллюстрируют результаты 3D сетки конечно-объемных элементов. Таким образом, они полезны для отображения результатов поля давления и поля скоростей с помощью окрашенных линий сетки или окрашенных узлов сетки соответственно.

При активации опции "Мин/Макс значения", показываются экстремальные значения выбранного типа результата. Вы можете отображать обычные значения, перемещая указатель по поверхности или в плоскости сечения.
В зависимости от выбранного типа результатов, вид "Твёрдая/Прозрачная модель" или вид "Каркасная модель" имеют преимущество при оценке результатов. Вы также можете выбрать параметр отображения модели из кнопки Список на панели инструментов.

