


Le opzioni "Campi scalari" disponibili nel navigatore "Vista" consentono di visualizzare i valori dei risultati relativi a ogni punto del modello in modi diversi.
In alternativa, selezionare l'opzione Visualizza dal pulsante Elenco nella barra degli strumenti.
Si noti che il tipo di visualizzazione deve corrispondere al tipo di risultato: ad esempio, le isosuperfici che rappresentano i risultati della mesh a volume finito 3D non possono essere applicate ai risultati di pressione della superficie 2D.

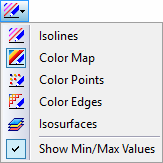
L'opzione di visualizzazione "Mappa dei colori" è impostata di default. Si adatta a tutti i tipi di risultati e visualizzazioni del modello, in quanto si adatta automaticamente. Nel pannello, i colori principali undici con i valori corrispondenti sono rappresentati. È possibile regolare sia i colori sia i valori, se necessario (vedi Capitolo Mappa dei colori).
Le isolinee rappresentano le linee di punti con risultati uguali. Per impostazione predefinita, undici colori sono assegnati alle linee con valori a intervalli equidistanti. Le isolinee possono essere utili per stampare grafici su una stampante monocromatica.
Le isosuperfici sono quelle superfici con valori identici all'uscita della mesh a volume finito 3D. Questa opzione può essere utilizzata per visualizzare un campo di pressione e i risultati del campo di velocità. È possibile selezionare più valori predefiniti o un singolo valore arbitrario.

Le opzioni "Colorare bordi" e "Colorare punti" illustrano i risultati della mesh a volume finito 3D. Pertanto, sono utili per visualizzare il campo di pressione e i risultati del campo di velocità mediante linee di mesh colorate o nodi di mesh colorati, rispettivamente.

Attivando l'opzione "Valori Min/Max", vengono mostrati i valori estremi del tipo di risultato selezionato. È possibile visualizzare i valori ordinari spostando il puntatore sulla superficie o nel piano della sezione.
A seconda del tipo di risultati selezionato, la vista "Modello Solido/Trasparente" o la vista "Modello a Filo di Ferro" è vantaggiosa per la valutazione dei risultati. È inoltre possibile selezionare l'opzione Visualizza Modello dal pulsante Elenco nella barra degli strumenti.

