


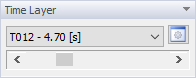
Quando si visualizzano grafici con la distribuzione delle quantità lungo una curva o su una linea-sonda, vengono visualizzati i valori del time layer corrente. Questo time layer può essere modificato sulla "Barra di modifica" senza dover chiudere la finestra del grafico, vedi Time layer.
È anche possibile avviare l'animazione del flusso, quindi la curva visualizzata nel grafico cambia automaticamente in base agli strati temporali. Il grafico consente anche di visualizzare tutte le curve (per tutti i livelli temporali contemporaneamente).
