


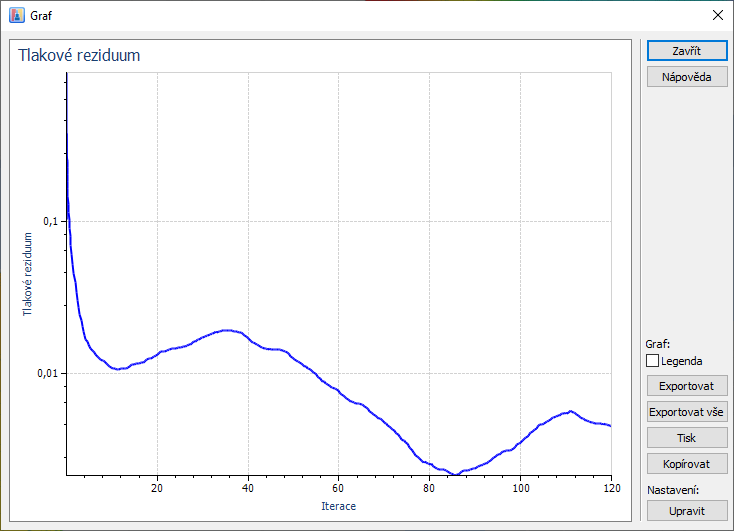
Během výpočtu je zobrazen diagram reziduí (viz obrázek Diagram Iterací a Reziduí ). Jedná se o logaritmický graf, který je k dispozici k prohlížení i po výpočtu.
Graf ilustruje průběh aplikovaného množství reziduí během iterativního simulačního procesu. Počínaje počáteční hodnotou množství reziduí, simulace zpřesňuje rezidua při každé iteraci, snaží se snížit nerovnováhu reziduí ve finálním objemu. Čím nižší jsou rezidua, tím přesnější bude řešení. Simulace se ukončí, když je dosaženo kritéria konvergence nebo maximálního počtu iterací (během výpočtu se vždy provede nejméně 300 iterací). Rezidua tedy představují důležitý nástroj pro posouzení konvergence simulace.
Grafy reziduí pro sledování konvergence numerického řešení byly rozšířeny o další množství, konkrétně o složky sil Fx, Fy, Fz působící na primární model a složky rychlosti Vx, Vy, Vz.

Iterativní výpočet můžete řídit pomocí nastavení v dialogovém okně "Parametry simulace" (viz kapitola Parametry simulace).
Pro změnu velikosti "Grafu reziduí a iterací" přesuňte rámy oken podle potřeby.
Pomocí tlačítka
![]() vytiskněte diagram. Zobrazí se dialogové okno "Windows Print", ve kterém můžete
vytiskněte diagram. Zobrazí se dialogové okno "Windows Print", ve kterém můžete
specifikovat tiskárnu a její nastavení.
Po kliknutí na tlačítko
![]() se otevře dialogové okno "Nastavení grafu". Zde můžete upravit
se otevře dialogové okno "Nastavení grafu". Zde můžete upravit
například rozvržení "Křivek".

Pokud diagram "Rezidua" odhalí jakékoli problémy ohledně konvergence, měli byste si zkontrolovat Parametry simulace (hustotu sítě, kritérium konvergence) a Větrný tunel. Pro posledně jmenovaný je výchozí velikost nastavena co nejmenší, aby se dosáhlo krátkých dob výpočtu. Pokud je jeho délka ve směru X příliš krátká (zejména v oblasti za objektem), mohou nastat efekty divergence a tedy oscilující hodnoty reziduálního tlaku. V takovém případě tunel prodlužte. Pro více informací viz kapitola Řešení problémů. V konkrétních případech jsou však oscilující výsledky správné, pokud se nacházejí v konzistentní šířce pásma bez zvyšování. Tento efekt je ilustrován v simulaci modelu válce na YouTube a vysvětlen v FAQ 4731.