


A função "Gráfico ao longo da linha" permite definir uma linha no modelo ou no plano slicer e, assim, criar um diagrama de cortes dos resultados ao longo da linha. O modelo "M05_Golf" no grupo de projeto "Demo", por exemplo, inclui algumas amostras de linha para os resultados do campo de fluxo de um modelo de carro.
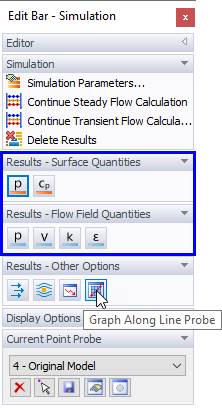
Para criar um gráfico de linhas, utilize o botão "Gráfico ao longo de uma linha de análise"
![]() que está disponível na secção Resultados do painel. Note que esta função apenas é aplicável para as quantidades de superfície e campo de fluxo.
que está disponível na secção Resultados do painel. Note que esta função apenas é aplicável para as quantidades de superfície e campo de fluxo.
Uma vez ativada a função, pode selecionar os pontos relevantes da linha (ou polilinha) através do clique do rato. As coordenadas dos pontos são apresentadas no painel que tem uma disposição específica para este fim. Aqui poderá também alterar o ajuste de objeto, se necessário. Quando tiver seleccionado dois (ou mais) pontos da linha, clique em
![]() .
.

Aparece a caixa de diálogo "Gráfico ao longo da curva".

Para definir este diagrama como Nova amostra de linha, utilize o
![]() . Aparece outra caixa de diálogo, onde pode introduzir o "Nome" da amostra e verificar as coordenadas de cada ponto.
. Aparece outra caixa de diálogo, onde pode introduzir o "Nome" da amostra e verificar as coordenadas de cada ponto.
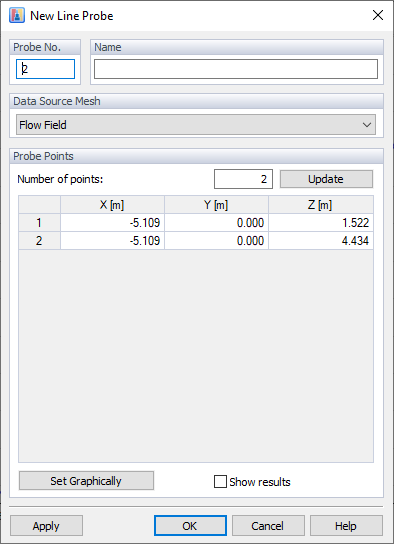
As opções da secção "Malha da fonte de dados" controlam a que tipo de malha as amostras se referem. As amostras de "Linha" são específicas para a malha de volume finito do campo de fluxo (para quantidades de campo de fluxo) ou do modelo simplificado (para quantidades de superfície), ver Capítulo Amostras.
Todas as amostras de linhas definidas pelo utilizador estão listadas no navegador "Dados". Utilize o menu de atalho de uma amostra de linha, que está disponível no navegador e nos gráficos, para exibir o diagrama e para alterar ou eliminar um item.

Os resultados de cada amostra de linha são guardados por pontos ao longo da linha. Note que estes não serão utilizados para a documentação de resultados no relatório de impressão do RFEM 6 ou do RSTAB 9.
Valores para a frente e para trás ao longo das curvas
Existe a possibilidade de representar a distribuição das quantidades ao longo das curvas ou das amostras de linha colocadas no modelo original. Até agora, isso não era possível (RWIND 1.x) devido ao risco de valores duplos (frente e verso) em alguns modelos (por exemplo, numa laje vertical fina com espessura zero). Este problema foi resolvido apresentando duas curvas no gráfico em tais casos, uma para os valores na frente e outra para os valores no verso do modelo. Para mais informação sobre os valores da frente e de trás, consulte o capítulo seguinte Secções, informação de secção de malha .

Problemas com a definição da amostra de linha
Existem alguns problemas em torno da definição correta das amostras de linha.
Se a amostra de linha é definida por apenas 2 pontos (A,B) durante a entrada gráfica, então a sua projecção no modelo é feita de tal forma que o segmento AB é dividido internamente em N pontos auxiliares e cada um tal é projectado para o ponto mais próximo do modelo. Em algumas situações, no entanto, isto pode dar um resultado indesejável. A solução é utilizar mais pontos de definição da amostra de linha ao introduzi-la graficamente.

Para modelos que contêm superfícies com espessura zero, é geralmente necessário orientar automaticamente os triângulos que definem a forma do modelo. No entanto, a orientação automática dos triângulos nem sempre é a ideal e, pelo contrário, a orientação original dos triângulos pode ser mais adequada. Por isso, recomendamos desativar a orientação automática dos triângulos quando existem problemas com as amostras de linhas. A ferramenta "Inspetor de malha" pode ser utilizada para verificar a orientação dos triângulos.
