During the calculation, a diagram showing the course of the maximum displacement is displayed (see image Calculation Progress ). You can also check this diagram in more detail after the calculation. Moreover, you can create user-defined calculation diagrams (CD) that display the convergence behavior on specific nodes of members, surfaces or supports. You can find the Calculation Diagrams on the Navigator - Data.
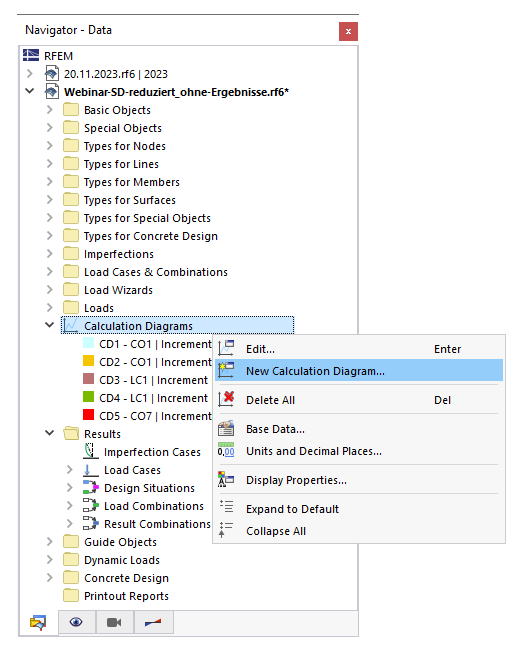
In the 'New Calculation Diagram' dialog box, you can define the criteria for displaying the results in the diagram.

Main
If no results are available yet, only the Main tab is available.
Diagram Type
There are two diagram types available in the list:
- 2D | Basic: You can individually specify which results are to be displayed on the horizontal and vertical axes of the diagram.
- 2D | Convergence Diagram: The diagram shows how the maximum deformation develops during the calculation.
Other input options in this dialog box are adapted to the diagram type that is set.
Source
In the list, you can select the 'Analysis type' to whose results the diagram will refer. If no 'Analysis Add-on' has been activated in the model's Base Data, only the 'Static Analysis' is available.
Define the load case or load combination whose results are to be displayed in the diagram. Result combinations and design situations are not available for selection because the diagram cannot display any enveloping results.
Horizontal Axis / Vertical Axis
In these two dialog sections, you can define the result criteria that are to be applied to the x- and y-coordinates. The options in the 'Result type' list depend on the Diagram Type.
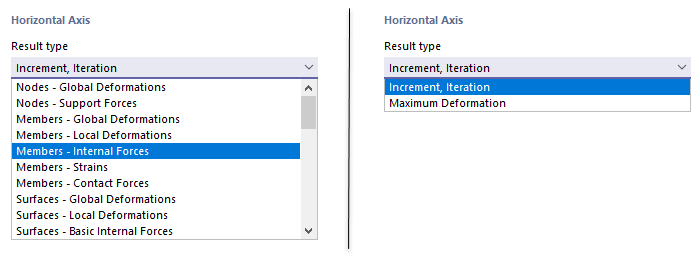
Set the 'Result type' for the horizontal axis. Usually, it is the 'Increment'. Then, you can assign a deformation or internal force or moment to the vertical axis for a basic diagram, or the maximum deformation for a convergence diagram.
If a basic diagram is set, select the displacement, rotation, or internal force and moment type in the 'Value' list. Then, define the 'Object' whose result you want to see in the diagram and specify the 'Node' for which this is done.

Diagram
The diagram is displayed as soon as the results of the load case or load combination are available. When you change a criterion, the graphic is updated automatically. In the Diagram tab, you can check the diagram in full view.
The green bar below a convergence diagram (see New Calculation Diagram) corresponds to the convergence curve as it appears in the Calculation Progress window.
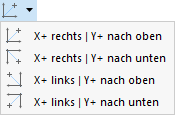
The buttons below the diagram have the following functions:
| List button with options for orientation of abscissa X and ordinate Y | |
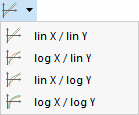
| List button with options for linear or logarithmic display of X and Y values | |
|
|
List button with options to print diagram |
|
|
Increases length of abscissa X |
|
|
Decreases length of abscissa X |
|
|
Increases length of ordinate Y |
|
|
Decreases length of ordinate Y |
|
|
Displays diagram with filled gradient |
|
|
Specifies maximum and minimum value |
Table
The Table tab is available as soon as the results of the load case or load combination are available.

The table lists the values that have been calculated in the individual iterations and load increments. As mentioned above, the results of the individual load increments must be saved when performing an incremental calculation.
The values of the selected row are indicated on the right in the diagram.
Diagram
The Diagram tab is available as soon as the results of the load case or load combination are available.

In this tab, the diagram is shown in full view. This facilitates targeted evaluations.
The list button
![]() provides various options that you can use for the documentation of the diagram (see Graphics chapter).
provides various options that you can use for the documentation of the diagram (see Graphics chapter).