


14.12.2022
036498
Organigramme schématique pour l’approche développée dans l’intégration de modèles BIM et SIG pour l’analyse des dommages dus au vent
Organigramme schématique pour l'approche développée visant à intégrer les modèles BIM et SIG pour l'analyse des dommages dus au vent
20.11.2024
036499
Algorithme Développé pour Connecter le Fichier Shapefile GIS au Modèle BIM Paramétrique via Revit Dynamo
Algorithme développé reliant fichier shapefile GIS et modèle BIM paramétrique via Revit Dynamo
20.11.2024
036500
Algorithme Python de Modélisation BIM Paramétrique pour Convertir un Plan de Bâtiment 2D en Solide 3D
Algorithme Python de modélisation BIM paramétrique pour convertir l'empreinte de bâtiment 2D en bâtiment solide 3D
20.11.2024
036501
Flux de travail schématique pour transformer un modèle communautaire SIG 2D en modèle BIM-SIG communautaire intégré 3D
Flux de travail schématique pour transformer le modèle communautaire 2D GIS en modèle intégré BIM-GIS 3D de la communauté
20.11.2024
036502
Génération de géométrie de niveau de la communauté pour les bâtiments : (A) Modèle BIM de la communauté ; (B) Géométrie basse résolution ; (C) Géométrie haute résolution ; (D–E) Gros plans sur les bâtiments montrant la taille de la maille utilisée pour générer la géométrie
Génération de géométrie au niveau communautaire pour les bâtiments : (A) Modèle BIM de la communauté ; (B) Géométrie basse résolution ; (C) Géométrie haute résolution ; (D-E) Vues rapprochées des bâtiments montrant la taille du maillage utilisé pour générer la géométrie.
20.11.2024
036503
Soufflerie numérique modélisée avec les flux de vent rsultants à travers la communauté : (A) Réglage de la soufflerie numérique ; (B) Flux de vent à travers la communauté ; (C) Gros plan sur le flux de vent modélisé
20.11.2024
036504
Variation spatiale de la vitesse et de la pression du vent au niveau communautaire : (A) Contour de vitesse du vent à travers la communauté ; (B) Pression du vent sur les bâtiments ; (C) Profil du vent un à Travers les Bâtiments ; (D) Profil du vent deux à travers les bâtiments
Variation spatiale de la vitesse et de la pression du vent au niveau communautaire : (A) Contour de la vitesse du vent à travers la communauté ; (B) Pression du vent sur les bâtiments ; (C) Profil de vent un à travers les bâtiments ; (D) Profil de vent deux à travers les bâtiments
20.11.2024
036505
Localisation géographique de Mexico Beach par rapport dans l’État de Floride avec vue rapprochée sur la zone d’étude choisie à Mexico Beach, en Floride
20.11.2024
036506
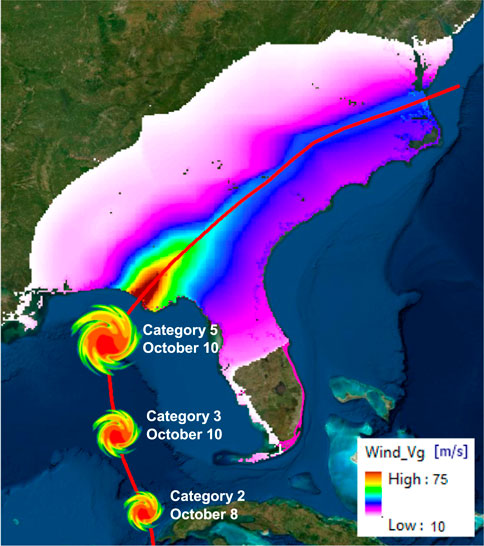
Évolution de l’ouragan Michael dans le golfe du Mexique et son impact sur les États-Unis avec la variation spatiale de la vitesse du vent dans le sud-est des États-Unis
Évolution de l’ouragan Michael dans le golfe du Mexique et son impact sur les États-Unis avec variation spatiale de la vitesse du vent dans le sud-est des États-Unis
20.11.2024
036507
Empreinte de bâtiment pour la zone d’étude à Mexico Beach, en Floride, avec nouveau modèle BIM et SIG : (A) Empreinte des bâtiments dans la zone d’étude ; (B) Modèle BIM pour la communauté ; (C) Modèle BIM de la communauté géoréférencé dans un environnement SIG 3D
Empreinte de bâtiment pour la zone d’étude à Mexico Beach, en Floride, avec nouveau modèle BIM et SIG : (A) Empreinte des bâtiments dans la zone d’étude ; (B) Modèle BIM de la communauté ; (C) Modèle BIM de la communauté géoréférencé dans un environnement SIG 3-D.
20.11.2024
036508
Image 11 : Flux de vent modélisé pour la zone d'étude : (A) Répartition spatiale de la vitesse du vent à travers la communauté; (B) Vue rapprochée des contours de vitesse du vent
Image 11 : Flux de vent modélisé pour la zone d'étude : (A) Spatial Distribution of Wind Speed Across Community; (B) Close-up View on Wind Speed Contours
20.11.2024
036509
Distribution de la Pression du Vent : (A) Distribution de la pression du vent de surface sur les bâtiments dans la communauté ; (B) Vue rapprochée de la distribution de la pression du vent au niveau des bâtiments
Distribution de la pression du vent : (A) Distribution de la pression du vent de surface sur les bâtiments dans la communauté ; (B) Vue rapprochée de la distribution de la pression du vent au niveau des bâtiments
20.11.2024
036510
Résultats d'Analyse du Flux Éolien : (A) Lignes de Flux Éolien à Travers la Communauté Codées par Couleur Selon la Variation de la Vitesse du Vent ; (B) Gros Plan sur la Variation du Flux Éolien et de la Vitesse du Vent
Résultats de l'analyse du flux d'air : (A) Lignes de flux d'air à travers la communauté codées par couleur selon la variation de leur vitesse de vent ; (B) Vue rapprochée de la variation du flux d'air et de la vitesse du vent.