
09-02-2025
055339
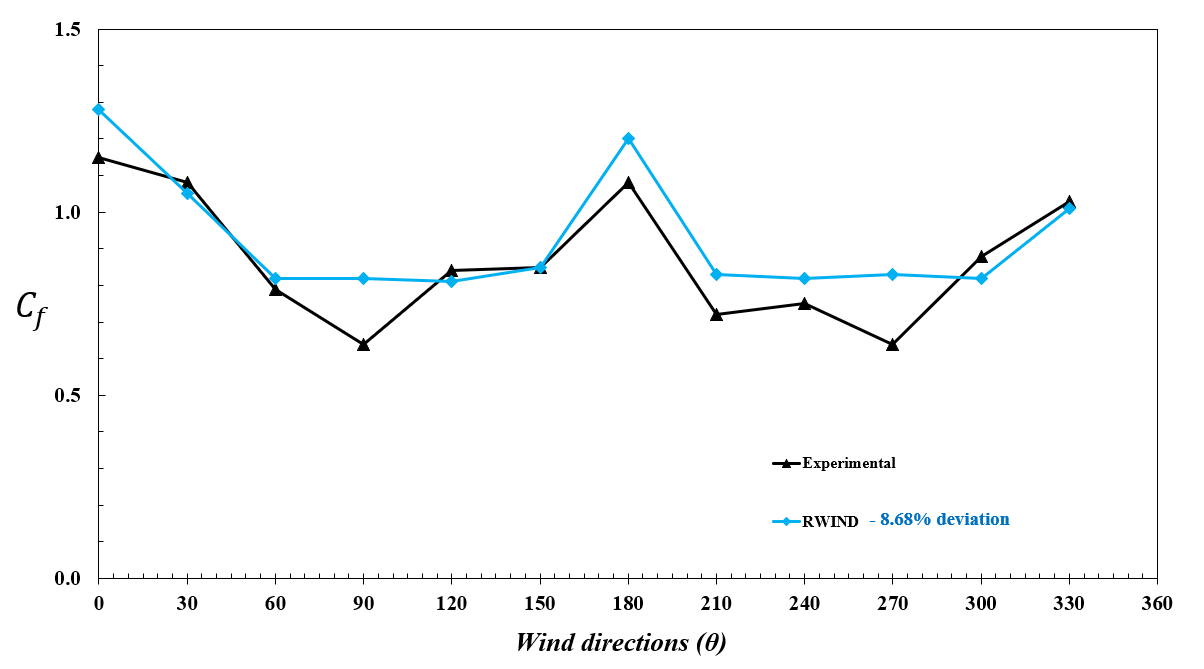
Comparación de los coeficientes de carga de viento obtenidos en el experimento y en la simulación de RWIND
Gráfico comparativo entre los coeficientes de carga de viento experimentales y los obtenidos mediante simulación de RWIND
El diagrama ilustra el coeficiente de fuerza Cf en función de la dirección del viento θ, que va de 0° a 360° en el eje x y de aproximadamente 0.0 a 1.5 en el eje y. Presenta una curva negra que representa los datos experimentales y una curva azul etiquetada como "RWIND – 8.68 % de desviación". Se producen desviaciones notables entre 30° y 60° y entre 150° y 210°, con la curva azul situándose a veces por encima y otras por debajo de los valores experimentales, lo que indica una desviación media del 8.68 %.