
2025-03-18
055854
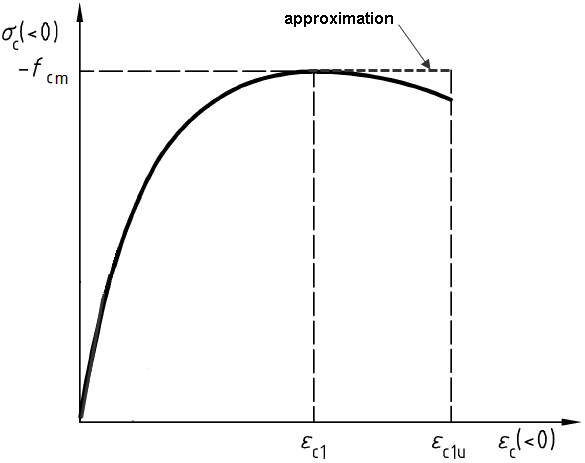
Image 2.132 Stress-Strain Diagram for Concrete in Compression
Diagram shows the stress-strain relationship for concrete in the compression area with characteristic points and slopes.
The graphic illustrates the stress-strain relationship for concrete, especially in the compression area. The strain is displayed on the horizontal axis, while the vertical axis shows the stress. Various characteristic points and transitions are recognizable, which illustrate the material properties of concrete under compression. The display is precise and uses technical terms to clarify the phases of stress and strain behavior.