
2025-02-01
055254
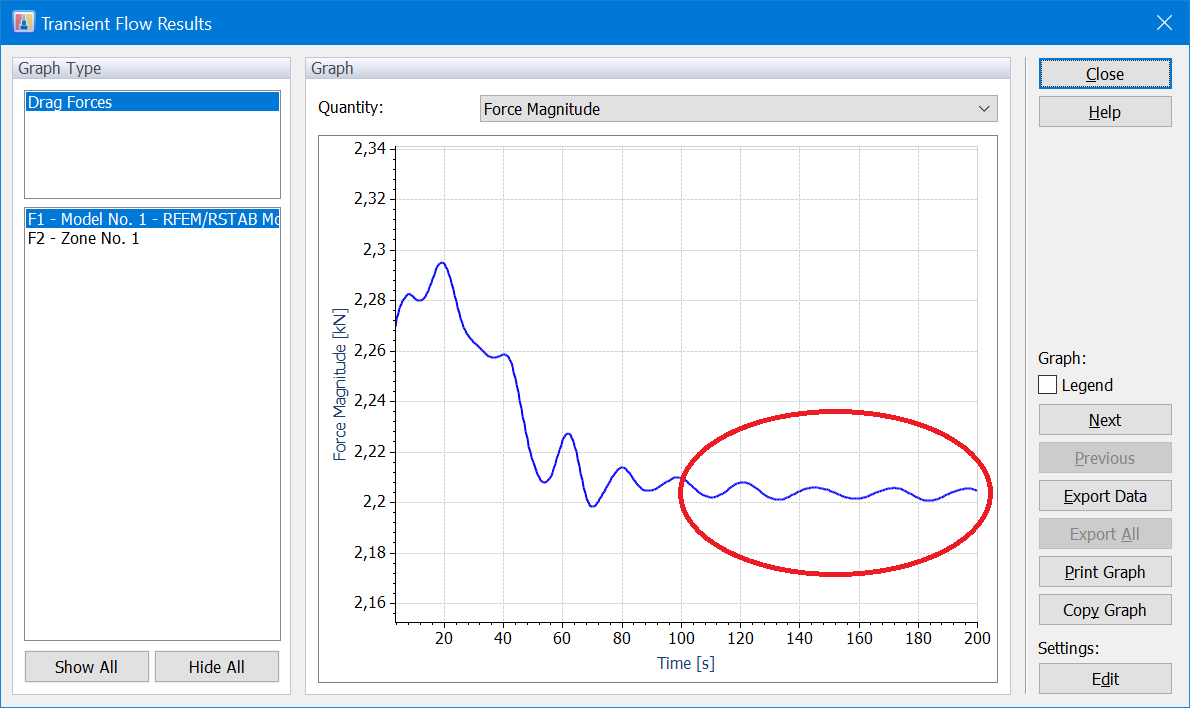
Stable Trend in Transient Simulation
Graph depicting a stable trend in a transient simulation analysis
The image displays a graph from a transient simulation where a single, consistent curve indicates a stable trend over time. The plot features clearly marked axes representing the simulation timeline and the measured response, emphasizing steady behavior in the dynamic analysis.